3. Calculate the amount of revenue for domestic producers before the quota and after.Before the quota, domestic producers received 500,000 x 50c = $250,000.After the quota, domestic producers received 1 million x $1 = $1 million.4. Identify the level of imports before the quota and after.Before the quota, imports start at the level of output where the domestic supply curvemeets the world supply curve, i.e. 500,000 litres, and finish where the world supplycurve equals demand, i.e. at 2.5 million litres. Thus the level of imports is 2.5 million– 500,00 = 2 million litres.After the quota, imports start at the level of output where the domestic supply curvemeets the world supply curve, i.e. 500,000 litres, and is limited to 1 million litres bythe quota. Thus the level of imports is 1 million litres.5. Calculate the amount of revenue for foreign producers before the quota and after.Before the quota, foreign producers received 2 million x 50c = $1 million.After the quota, foreign producers received 1 million x $1 = $1 million.6. Calculate the fall in consumer surplus resulting from the imposition of the quota.The consumer surplus will fall by a total of the areas A+B+C+D+E+F.A+B+C+D+E = 2 million x 50c = $1 million. F = ½ x 500,000 x 50c = $125,000.So, the total loss of consumer surplus is $1,125,000.7. Calculate the dead-weight losses suffered as a result of imposing the quota.The dead-weight losses are represented by areas E and F.Area E is the extra cost to “the world” of the output that is now produced by inefficientdomestic producers, instead of efficient foreign producers = ½ x 500,000 x 50c =$125,000.Area F is the loss of consumer surplus from products that are no longer consumedand was calculated above to also be $125,000.Calculating from diagrams the effects of giving a subsidy to domestic producers ondifferent stakeholders, including domestic producers, foreign producers, consumersand the government.Once a diagram has been given or drawn, you may be asked to include world supply curvesand subsidies and to calculate different effects of the subsidy.E.g. Using the diagram on page 56:1. Add the world supply curve if foreign producers are prepared to supply cooking oil at$0.50. Then show the effect on the diagram of the government giving a subsidy of$0.50 per unit on all domestic production of cooking oil.This is simple and you just have to add a perfectly elastic supply curve to thediagram, at a price of $0.50. and label it S World .Then you shift the domestic supply curve downwards by 50c at all levels of outputand label it S + Subsidy.Produced by Ian Dorton & Jocelyn Blink Page 59
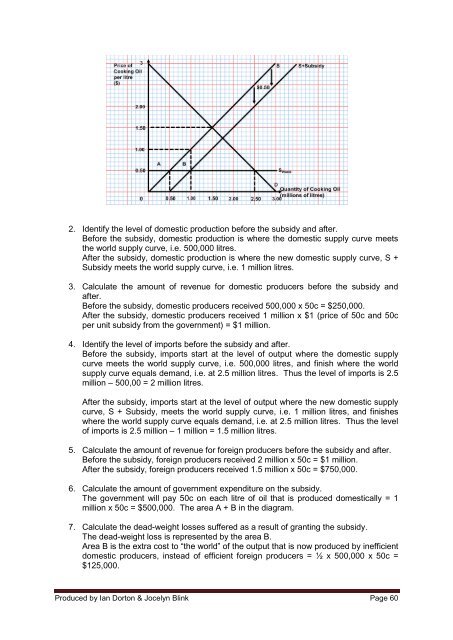
2. Identify the level of domestic production before the subsidy and after.Before the subsidy, domestic production is where the domestic supply curve meetsthe world supply curve, i.e. 500,000 litres.After the subsidy, domestic production is where the new domestic supply curve, S +Subsidy meets the world supply curve, i.e. 1 million litres.3. Calculate the amount of revenue for domestic producers before the subsidy andafter.Before the subsidy, domestic producers received 500,000 x 50c = $250,000.After the subsidy, domestic producers received 1 million x $1 (price of 50c and 50cper unit subsidy from the government) = $1 million.4. Identify the level of imports before the subsidy and after.Before the subsidy, imports start at the level of output where the domestic supplycurve meets the world supply curve, i.e. 500,000 litres, and finish where the worldsupply curve equals demand, i.e. at 2.5 million litres. Thus the level of imports is 2.5million – 500,00 = 2 million litres.After the subsidy, imports start at the level of output where the new domestic supplycurve, S + Subsidy, meets the world supply curve, i.e. 1 million litres, and finisheswhere the world supply curve equals demand, i.e. at 2.5 million litres. Thus the levelof imports is 2.5 million – 1 million = 1.5 million litres.5. Calculate the amount of revenue for foreign producers before the subsidy and after.Before the subsidy, foreign producers received 2 million x 50c = $1 million.After the subsidy, foreign producers received 1.5 million x 50c = $750,000.6. Calculate the amount of government expenditure on the subsidy.The government will pay 50c on each litre of oil that is produced domestically = 1million x 50c = $500,000. The area A + B in the diagram.7. Calculate the dead-weight losses suffered as a result of granting the subsidy.The dead-weight loss is represented by the area B.Area B is the extra cost to “the world” of the output that is now produced by inefficientdomestic producers, instead of efficient foreign producers = ½ x 500,000 x 50c =$125,000.Produced by Ian Dorton & Jocelyn Blink Page 60