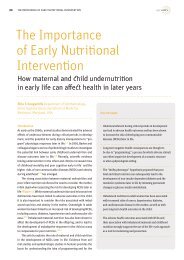
18 INTRAUTERINE PROGRAMMING OF NCDfigure 1: Thin-Fat Indian Baby. A schematic diagram to compare the body composition <strong>of</strong> Indian and white Caucasian babies.5, 21Indian babies were ≈ 800 g lighter, muscle thin but more adipose compared to the white babies.white caucasian, 3500 gindian, 2700 gFatMuscleVisceraOtherFatMuscleVisceraOtherThe role <strong>of</strong> DNA methylation in influencing the phenotype <strong>of</strong> agrowing fetus has been well demonstrated in animal models.Feeding pregnant Agouti mice with a methylating cocktail (vitaminB₁₂ + folate + betaine + choline) changes the coat colorand reduces obesity, despite inheritance <strong>of</strong> the mutation. 10 Thechange in phenotype is linked to methylation in the promoterregion <strong>of</strong> the Agouti gene, which silences it.Evidence from Pune studiesResearch at the Diabetes Unit, King Edward Memorial Hospital,Pune has made important contributions to <strong>programming</strong> research.Our original observation was that diabetes occurred inIndians at a much lower body mass index (BMI), as compared toEuropeans, and that this could in part be due to their higher centralobesity and higher body fat percent, or adiposity. 11 This ledto the “thin-fat” Indian concept. Many suggested that this was“genetically” determined, but we have not found any major differencesin genetic associations <strong>of</strong> T2D in Indians compared toEuropeans. 12 In 1991, we joined David Barker and Caroline Fallin their “fetal origins” research. The first collaborative research(Pune Children Study) confirmed that low birth weight was associatedwith insulin resistance as early as four years <strong>of</strong> age, 13 andthat children who were born small but grew big in childhood hadthe highest level <strong>of</strong> risk factors for diabetes and cardiovasculardisease. 14 We realized that <strong>intrauterine</strong> undernutrition could bean important contributor to the risk <strong>of</strong> adult disease. At the sametime, we knew that fetal overnutrition (as in maternal diabetes)also increases the risk <strong>of</strong> obesity and diabetes in the child. 15 Thestage was set to investigate the factors influencing fetal growthand <strong>programming</strong>. This was the birth <strong>of</strong> the Pune Maternal NutritionStudy (PMNS).The PMNS was established between 1993 and 1996 in six villagesnear Pune, to investigate the influence <strong>of</strong> maternal bodysize and nutrition during pregnancy on fetal growth and itsfuture metabolic risks. <strong>16</strong> We also investigated the fathers’ contributions.Over 800 pregnancies were studied. Children werevisited every six months for anthropometric measurements, andparents and children were investigated every six years for a detailedassessment <strong>of</strong> body composition, cardio-metabolic riskfactors and neurocognitive development.Predictors <strong>of</strong> fetal growth and birth sizeFetal growth and size are influenced by genes, parental bodysize, maternal nutrition and the mother’s metabolic and vascularcompetence during pregnancy. Our measurements were guidedby McCance’s writings <strong>of</strong> over 50 years ago: “The size attainedin utero depends on the services which the mother is able to provide;these are mainly food and accommodation.” 17 We assessedmaternal nutrition via anthropometric measurements, nutrientintake and physical activity, and by measurement <strong>of</strong> circulatingnutrient levels.Maternal body size, body compositionand weight gain during pregnancyThe average mother in the PMNS was 21 years old, weighed42 kg (BMI 18.1 kg/m²), and ate ≈1,700 kcal and 45 g proteinsper day during pregnancy. The newborns weighed on average2,700 g with a ponderal index (PI) <strong>of</strong> <strong>24</strong>.1 kg/cm³; 28% wereLBW (< 2,500 g). 18Babies <strong>of</strong> heavier mothers were larger in all aspects, and babies<strong>of</strong> taller mothers were longer. Maternal fat measurementsinfluenced the baby’s weight and skin folds. It is interesting that
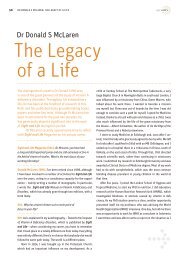
SIGHT AND LIFE | VOL. 25 (2) | 2011 INTRAUTERINE PROGRAMMING OF NCD 1919paternal size predominantly influenced skeletal measurements,while the baby’s adiposity was predominantly determined bymaternal factors. Short and fat mothers gave birth to the mostadipose babies, suggesting an intergenerational influence <strong>of</strong>maternal early life “growth retardation” and the mother’s subsequentweight gain on body composition <strong>of</strong> the growing fetus. 17One more interesting finding was that babies born to multiparouswomen had higher skin folds and a higher abdominal circumferencethan those born to primiparous women. 19“A gain in maternal tissue during earlyweeks is an important determinant <strong>of</strong>fetal growth”Maternal weight gain during the first 18 weeks influenced allneo-natal measurements, indicating that a gain in maternaltissue during early weeks is an important determinant <strong>of</strong> fetalgrowth. Placental volume measurement at 18 weeks’ gestationwas also an independent determinant <strong>of</strong> fetal growth, highlightingthe role for this important organ. 20The “thin-fat” Indian babyWe compared the birth measurements <strong>of</strong> Indian babies withthose <strong>of</strong> white Caucasian babies born in Southampton, UK. Indianbabies were lighter (2.7 vs. 3.5 kg, z score -1.74), shorter (47.3vs. 50.2 cm, z score -1.01) and thinner (PI <strong>24</strong>.5 vs. 28.2 kg/cm³,z score -1.62), but their sub-scapular skin fold measurementswere relatively well preserved (4.2 vs. 4.6 mm, z score -0.53). Atany sub-scapular skin fold thickness, Indian babies had a lowerPI than that <strong>of</strong> the white Caucasian babies. 21In a subsequent study, we used whole body MRI to calculatebody fat and its regional distribution in neonates. Compared tothe larger white Caucasian babies, the Indian babies had similarwhole body adipose tissue content (“thin-fat”) and significantlyhigher absolute adiposity in all three abdominal compartments,viz internal (visceral), deep subcutaneous and superficial subcutaneous.Non-abdominal superficial subcutaneous adipose tissuewas, however, lower. 22 Thus, Indian babies are more adiposeand have a fat distribution that is suggestive <strong>of</strong> a higher risk <strong>of</strong>diabetes, as compared to white Caucasian babies.(Figures 1 and 2)figure 2: Thin-Fat Indian Baby. Anthropometry and MRI comparison <strong>of</strong> Indian and white Caucasian babies. Despite their anthropometricsmallness, Indian babies had a higher amount <strong>of</strong> fat in subcutaneous and visceral abdominal compartments. White Caucasian babiesare used as reference, and z scores for Indian babies are plotted. 22 This figure is not to scale. The figure highlights relative adiposity <strong>of</strong>Indian newborns.3.002.00Mean z score (95% CI)1.000.00–1.00–2.00Anthropometry Abdominal Non-AbdominalWeightHead circumferenceLengthInternal-abdominalDeep subcutaneous abdominalSuperficial subcutaneous abdominalInternal non-abdominalDeep subcutaneous non-abdominalSuperficial subcutaneous non-abdominalTotal adipose tissue