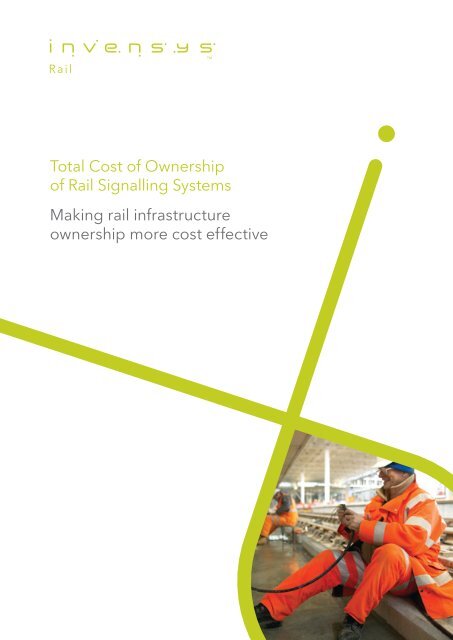
Total Cost of Ownership of Rail Signalling Systems ... - Invensys Rail
Total Cost of Ownership of Rail Signalling Systems ... - Invensys Rail
Total Cost of Ownership of Rail Signalling Systems ... - Invensys Rail

You also want an ePaper? Increase the reach of your titles
YUMPU automatically turns print PDFs into web optimized ePapers that Google loves.
<strong>Total</strong> <strong>Cost</strong> <strong>of</strong> <strong>Ownership</strong><br />
<strong>of</strong> <strong>Rail</strong> <strong>Signalling</strong> <strong>Systems</strong><br />
Making rail infrastructure<br />
ownership more cost effective<br />
I300203_<strong>Invensys</strong>_<strong>Cost</strong>Of<strong>Ownership</strong>_WhitePaper.indd 1 13/04/2010 15:11
The Sponsor and the Author<br />
Executive Summary<br />
Introduction<br />
Methodology<br />
Approach<br />
Participants<br />
TCO model structure<br />
TCO life stage and cost drivers<br />
Finding 1: The largest component<br />
Variances between operators<br />
Comparisons with telecoms<br />
Better performance through greater<br />
planned maintenance intensity?<br />
Finding 2: The main cost driver<br />
Finding 3: Improving failure rates<br />
The cost <strong>of</strong> delays<br />
Reducing delays through motivation<br />
Reducing delays through technology<br />
Finding 4: Ideas to reduce TCO<br />
Ideas Summary<br />
Incremental improvements<br />
Thoughts for the future<br />
I300203_<strong>Invensys</strong>_<strong>Cost</strong>Of<strong>Ownership</strong>_WhitePaper.indd 2-3 13/04/2010 15:11<br />
Contents<br />
5<br />
6<br />
8<br />
9<br />
9<br />
9<br />
9<br />
10<br />
12<br />
13<br />
13<br />
13<br />
15<br />
16<br />
16<br />
17<br />
18<br />
20<br />
21<br />
22<br />
22
<strong>Total</strong> <strong>Cost</strong> <strong>of</strong> <strong>Ownership</strong> <strong>of</strong> <strong>Rail</strong> <strong>Signalling</strong> <strong>Systems</strong> <strong>Total</strong> <strong>Cost</strong> <strong>of</strong> <strong>Ownership</strong> <strong>of</strong> <strong>Rail</strong> <strong>Signalling</strong> <strong>Systems</strong><br />
4<br />
The Sponsor<br />
and the Author<br />
<strong>Invensys</strong> <strong>Rail</strong> is a multinational leader in<br />
delivering state <strong>of</strong> the art railway control<br />
and communication solutions. We enable<br />
the world’s railways to help meet the ever<br />
increasing demand for rail services by<br />
providing a range <strong>of</strong> solutions that safely<br />
increase the capacity <strong>of</strong> their networks<br />
by increasing frequency and maximising<br />
operational effectiveness.<br />
Employing over 4,000 employees<br />
worldwide, <strong>Invensys</strong> <strong>Rail</strong> operates<br />
through a network <strong>of</strong> regional<br />
centres and delivers products<br />
to meet the needs <strong>of</strong> high speed,<br />
mainline and mass transit<br />
customers in over 30 countries.<br />
We design, manufacture, supply, install,<br />
commission and maintain a range <strong>of</strong> safety<br />
related rail automation and control systems<br />
and equipment. Our broad <strong>of</strong>fering ranges<br />
from highly complex integrated control centre<br />
solutions that supervise and control complete<br />
railways, sophisticated train based systems<br />
that automate train operation and protection,<br />
interlocking systems that ensure safe running<br />
across a network and a complete range <strong>of</strong><br />
trackside products.<br />
More information can be found at<br />
www.invensysrail.com<br />
Credo is a strategy consultancy.<br />
They advise on business agendas<br />
including strategy, growth,<br />
execution and performance.<br />
Credo has worked extensively in the UK, US,<br />
Australian and Eastern European rail markets.<br />
Credo’s particular expertise is in Business<br />
Services. They are recognised as the leading<br />
UK consultancy in Support Services (including<br />
Construction, Transport, PPP and Telecom<br />
Services). Their clients include leading names in<br />
sectors such as IT, BPO, Transport and Logistics,<br />
Utilities and Network Infrastructures.<br />
In each <strong>of</strong> these areas we recognise the subtle<br />
and unique demands placed on business<br />
services companies. Our strength lies in a<br />
combination <strong>of</strong> our wide-ranging relationships<br />
and deep industry knowledge which allows us<br />
to consistently demonstrate thought-leadership.<br />
Visit www.credo-group.com<br />
for more information<br />
I300203_<strong>Invensys</strong>_<strong>Cost</strong>Of<strong>Ownership</strong>_WhitePaper.indd 4-5 13/04/2010 15:11<br />
5
<strong>Total</strong> <strong>Cost</strong> <strong>of</strong> <strong>Ownership</strong> <strong>of</strong> <strong>Rail</strong> <strong>Signalling</strong> <strong>Systems</strong> <strong>Total</strong> <strong>Cost</strong> <strong>of</strong> <strong>Ownership</strong> <strong>of</strong> <strong>Rail</strong> <strong>Signalling</strong> <strong>Systems</strong><br />
6<br />
Executive<br />
Summary<br />
Lifecycle costs are a well<br />
understood concept in<br />
networked infrastructure<br />
assets, for example, in<br />
utilities and telecoms. In<br />
the rail industry the concept<br />
is less widespread but no<br />
less useful a tool to inform<br />
resource allocation decisions<br />
or assess the relative merits<br />
<strong>of</strong> different rail signalling<br />
technologies across the<br />
whole asset lifecycle. <strong>Cost</strong><br />
is not the only factor in<br />
implementing a signalling<br />
system, but it is an area<br />
that interests all rail<br />
infrastructure operators.<br />
We set out to build a <strong>Total</strong> <strong>Cost</strong> <strong>of</strong> <strong>Ownership</strong><br />
(TCO) model to quantify the cost <strong>of</strong> various<br />
lifecycle stages from scheme design through<br />
to implementation, operation and maintenance.<br />
We populated the model with real-life data<br />
provided by rail infrastructure operators from<br />
Europe, US and Asia Pacifi c.<br />
We have normalised our fi ndings to allow<br />
for differences in labour rates and track<br />
confi guration; the resulting costs should<br />
be fairly comparable and therefore we can<br />
confi dently draw reasonable conclusions<br />
about the distribution <strong>of</strong> TCO by life stage.<br />
We draw four key conclusions:<br />
1 Around 60% <strong>of</strong> the TCO <strong>of</strong> a rail signalling<br />
system is associated with the initial outlay for<br />
implementation (covering design, acquisition,<br />
installation, testing and commissioning).<br />
This compares with c.40% <strong>of</strong> costs related to<br />
the ongoing running <strong>of</strong> the system (covering<br />
operation, planned and reactive maintenance<br />
and penalties, where applicable).<br />
The distribution in TCO costs in rail is notably<br />
biased towards implementation. To put this<br />
into context, in other industries, TCO tends<br />
to be more biased towards ongoing costs.<br />
In telecoms networks, implementation costs<br />
are closer to c.30% <strong>of</strong> TCO and ongoing costs<br />
are c.70% <strong>of</strong> TCO. The telecoms industry,<br />
though not directly comparable to rail, does<br />
share some things in common – asset availability<br />
levels are demandingly high, infrastructure<br />
is capital intensive, it is regulated and most<br />
networks are more technically complex than<br />
a signalling system.<br />
Although the rail industry is quite rightly focused<br />
on reducing costs during the implementation<br />
phase, the quality <strong>of</strong> equipment and installation<br />
should not be ignored. Indeed high quality<br />
engineering during the implementation phase in<br />
critical in ensuring TCO is reduced, particularly as<br />
benefi ts and return on investment <strong>of</strong>ten accrue<br />
during the last few years <strong>of</strong> a project. In addition<br />
and increasingly common place thanks to<br />
increasing competition, operators are <strong>of</strong>ten lured<br />
into focusing on solely on price and not quality,<br />
the implications <strong>of</strong> which are <strong>of</strong>ten felt many<br />
years into operation.<br />
2 <strong>Rail</strong> is a manpower intensive business. Labour<br />
costs for activities such as design, implementation<br />
and, most signifi cantly, maintenance represent<br />
half <strong>of</strong> TCO. Flexibility in labour models, using<br />
external contractors to perform infrequent tasks,<br />
would give operators greater leverage.<br />
3 Failure rates not only drive the cost <strong>of</strong><br />
maintenance but also have a signifi cant impact<br />
on network availability. We have seen various<br />
methods employed to reduce failure rates, two<br />
<strong>of</strong> the most effective have been:<br />
i. Monitor and publish performance information<br />
at the team level. Field engineers need to feel<br />
their efforts have consequences both good<br />
(appealing to pride) and bad (appealing to<br />
competitiveness). This has resulted in a 44%<br />
reduction in failures at one operator. A further<br />
enhancement to this is to set targets and reward<br />
performance, again at the team level – this tends<br />
to stimulate innovation (in working practice) and<br />
faster or more effective problem resolution.<br />
ii. Condition-based asset monitoring. Being<br />
able to monitor a component to get early<br />
warning <strong>of</strong> imminent failure allows maintenance<br />
resource to be directed more economically and<br />
failures to be avoided.<br />
4 Reducing TCO is the end goal once the<br />
distribution <strong>of</strong> costs across life stages and<br />
cost drivers are understood. We note several<br />
ideas – some big (entailing capital investment),<br />
some small (minimal cost) that both operator<br />
and equipment vendors can drive:<br />
i. Modular equipment. Off-site assembly and<br />
testing <strong>of</strong> discrete standardised signalling<br />
modules enables a more effi cient and robust<br />
approach to system testing. It also requires less<br />
time onsite thereby reducing disruption to the<br />
network and allows testing to be completed with<br />
fewer possessions (which is expensive as most<br />
<strong>of</strong> our operators were capacity constrained).<br />
ii. Handheld technology to de-skill/improve<br />
quality <strong>of</strong> installation. Use <strong>of</strong> mobile handheld<br />
technology to run testing and commissioning<br />
scripts/routines allows elements <strong>of</strong> the testing<br />
process to be de-skilled which in turn reduces<br />
reliance on scarce engineering resource and<br />
allows a more methodical and robust approach<br />
to installation. The latter point was particularly<br />
stressed by an operator who conceded that the<br />
quality <strong>of</strong> installation was one <strong>of</strong> the biggest<br />
sources <strong>of</strong> subsequent equipment failure.<br />
iii. In situ component reliability shared with<br />
equipment vendor. There was a surprising lack<br />
<strong>of</strong> information sharing between operator and<br />
equipment vendor, at best this was done in an<br />
ad hoc fashion. Where the feedback loop was<br />
well-established, unsurprisingly there was better<br />
product performance. This was particularly<br />
important as a high proportion <strong>of</strong> failures tended<br />
to be traced to a small number <strong>of</strong> components<br />
that repeated failed.<br />
iv. Condition-Based Maintenance (CBM).<br />
Early detection <strong>of</strong> potential component failure<br />
(components reporting issues themselves) allows<br />
maintenance resource to be prioritised by need<br />
rather than routine and failures to be avoided.<br />
There’s a less capital intensive approach to CBM<br />
that compares usage data against statistical data<br />
to predict failures, this may appeal to operators who<br />
have large networks that make the retro-fi tting <strong>of</strong><br />
sensors an unwieldy and expensive task.<br />
v. Planned maintenance regimes that take into<br />
account the proximity <strong>of</strong> assets allow multiple<br />
components to be inspected during the same visit<br />
– this reduces travel time which can be equivalent<br />
to the time spent on an inspection. A further step<br />
to increase effi ciency and consistency would be<br />
to link maintenance regimes to components in the<br />
asset register which could in turn drive a workload<br />
management system. Engineers could then<br />
have their scheduled tasks downloaded to their<br />
handheld device and update the asset history<br />
on completion <strong>of</strong> the inspection.<br />
vi. Handheld technology as a training tool.<br />
The diversity <strong>of</strong> signalling equipment that needs<br />
to be maintained by an engineer presents a<br />
training challenge. Handheld-based maintenance<br />
instructions (checklists) linked to an asset register<br />
which holds the components maintenance history<br />
allows faster fault resolution; improved proportion<br />
<strong>of</strong> fi rst time fi xes; and can reduce the reliance on<br />
classroom training. Another tool is visualisation,<br />
where engineers can train in simulated 3D<br />
environments, this has been used successfully<br />
in the oil and gas industry to allow engineers to<br />
practice in real-life situations.<br />
Idea Summary<br />
Figure 1<br />
Levers for implementation cost reduction<br />
• Modular equipment<br />
• Handheld technology to expedite and improve the quality<br />
<strong>of</strong> installation<br />
• Earlier vendor involvement in signalling scheme design<br />
Savings levers for ongoing costs<br />
• Condition-based asset monitoring and maintenance<br />
• Handheld technology for training and issue resolution<br />
• Monitor and publish performance to improve failure rates<br />
• Share in situ component reliability statistics with vendors<br />
• Design planned maintenance regimes that take into<br />
account the proximity <strong>of</strong> assets that need inspection<br />
• 3D visualisation training tools<br />
“ the quality <strong>of</strong> equipment<br />
& installation should not<br />
be ignored.”<br />
I300203_<strong>Invensys</strong>_<strong>Cost</strong>Of<strong>Ownership</strong>_WhitePaper.indd 6-7 13/04/2010 15:11<br />
7
<strong>Total</strong> <strong>Cost</strong> <strong>of</strong> <strong>Ownership</strong> <strong>of</strong> <strong>Rail</strong> <strong>Signalling</strong> <strong>Systems</strong><br />
8<br />
Introduction<br />
Historically, operators<br />
have based their signalling<br />
purchasing decisions on<br />
upfront costs, balancing<br />
required functionality<br />
against the lowest capital<br />
outlay. This disregards the<br />
<strong>Total</strong> <strong>Cost</strong> <strong>of</strong> <strong>Ownership</strong><br />
which most operators have<br />
expressed an interest in but<br />
rarely have the time or data<br />
to calculate it.<br />
By developing a TCO model, we believe<br />
operators can make better informed decisions<br />
on how to manage the whole asset lifecycle<br />
more cost effectively. It can inform trade <strong>of</strong>fs,<br />
for example, <strong>of</strong> functionality against ease <strong>of</strong><br />
maintenance. It can also improve the focus on<br />
reliability; very few operators assign a cost to<br />
delays caused by the system. If this were factored<br />
in perhaps more emphasis would be paid to<br />
optimising maintenance regimes and fault<br />
resolution before the purchasing decision was<br />
made. The value <strong>of</strong> whole life costing has been<br />
acknowledged by rail and metro operators and<br />
we know <strong>of</strong> at least three companies that have<br />
been successful at developing lifecycle costing<br />
for their network.<br />
There are further benefi ts to using a TCO method<br />
in rail signalling:<br />
• Solutions are procured to address whole life costs<br />
• Encourages equipment vendors to develop<br />
products that support simpler installation,<br />
testing and maintenance. This does not belittle<br />
the importance <strong>of</strong> signalling functionality<br />
designed to increase capacity on the network<br />
• Stimulates a debate at the operators that<br />
cuts across the silo-think that prevails in<br />
many large organisations<br />
• A TCO model is good way <strong>of</strong> getting<br />
procurement managers, planning and design<br />
engineers and maintenance managers to<br />
discuss how best to allocate resources<br />
• It can help inform strategic decisions taken<br />
by the regulator and asset owner on the<br />
balance <strong>of</strong> funding required between capital<br />
investment and operating expenses<br />
• TCO is underpinned by a fi nancial model<br />
that can be used for managing and reporting<br />
fi nancial performance<br />
We set out our methodology for developing a<br />
TCO model for rail signalling; we share our key<br />
fi ndings and suggest ways to reduce TCO.<br />
The objective <strong>of</strong> the paper is to stimulate a<br />
debate in the industry between asset owners/<br />
operators, equipment vendors and regulators.<br />
If you would like to learn more about our<br />
methods or indeed, if you would like to have<br />
a TCO model developed for your asset please<br />
approach either Credo or <strong>Invensys</strong> <strong>Rail</strong>.<br />
We would like to extend our thanks to the<br />
operators that have kindly contributed their<br />
insights and time to help us populate the model<br />
with real-life data – you helped bring to life an<br />
otherwise theoretical concept.<br />
Methodology<br />
Approach<br />
The TCO financial model was designed to address<br />
the drivers <strong>of</strong> cost at each life stage. We then<br />
collected real-life data from the participants to<br />
populate the model. Given the diversity in local<br />
conditions at each operator, we had to select a<br />
comparable ‘baseline’ section <strong>of</strong> route at each.<br />
This was defined by the following characteristics:<br />
• 30km route, principally used for commuter rail<br />
• Computer based interlocking<br />
• Track circuits or axle counters for train detection<br />
• Electrified track<br />
• In operation for over 5 years<br />
Data was gathered through meetings with<br />
representatives from: strategy & planning;<br />
signal design; procurement; estimating; field<br />
maintenance and performance management.<br />
We normalised our results for significant<br />
variables such as labour rates and track<br />
configuration (double, triple tracks). However,<br />
there are several cost drivers that drove diversity<br />
in the results and could not be normalised:<br />
• <strong>Signalling</strong> equipment type<br />
• Mix <strong>of</strong> labour internal vs external<br />
(external labour is at higher rates)<br />
• <strong>Signalling</strong> complexity<br />
• Maintenance regimes<br />
There were other subtle differences that affect<br />
local operating conditions and indirectly impact<br />
our findings, for example, regulatory conditions<br />
(that can mandate inspections); asset ownership<br />
and management responsibility; cultural and<br />
management disciplines.<br />
Figure 2: <strong>Total</strong> <strong>Cost</strong> <strong>of</strong> <strong>Ownership</strong> model structure<br />
Services<br />
Solution<br />
Component<br />
<strong>Total</strong> <strong>Cost</strong> <strong>of</strong> <strong>Ownership</strong> <strong>of</strong> <strong>Rail</strong> <strong>Signalling</strong> <strong>Systems</strong><br />
Participants<br />
People <strong>Cost</strong>s Fact <strong>Cost</strong>s<br />
Setup<br />
Management<br />
Design<br />
Installation<br />
Testing<br />
Commissioning<br />
Preventative Maintenance<br />
Reactive Maintenance<br />
Penalties<br />
There are rarely more than a handful <strong>of</strong> operators<br />
in a single country, <strong>of</strong>ten there is just one rail<br />
metro operator per country, therefore, by<br />
necessity the study had to have an international<br />
perspective. The participants come from three<br />
regions – North America, Europe and Australasia.<br />
Three <strong>of</strong> the four participants are <strong>Invensys</strong><br />
customers, one is not. They were self-selecting,<br />
in that they all had a desire to understand TCO.<br />
Credo conducted this study independently<br />
<strong>of</strong> <strong>Invensys</strong> to protect operator data and<br />
commercial confidentiality.<br />
The intention <strong>of</strong> the study was not to benchmark<br />
operators against one another, rather to develop<br />
a TCO model that was representative for a typical<br />
operator. We couldn’t entirely resist making<br />
comparisons so where they provide useful<br />
insights or suggestions for reducing TCO,<br />
we make these observations.<br />
The data we gathered was complete for three<br />
participants, we refer to them as Operator A,<br />
Operator B and Operator C, the fourth,<br />
Operator D contributed partial information<br />
and therefore was not included in all analyses.<br />
TCO model structure<br />
The model is follows the structure shown in Figure 2.<br />
• Services – these are costs associated with the<br />
signalling system. They are either ‘people’<br />
costs (labour related) or ‘fact’ costs (such as<br />
equipment or other items with a definable price)<br />
• Components – services are wrapped up into<br />
the component that they deliver<br />
I300203_<strong>Invensys</strong>_<strong>Cost</strong>Of<strong>Ownership</strong>_WhitePaper.indd 8-9 13/04/2010 15:11
<strong>Total</strong> <strong>Cost</strong> <strong>of</strong> <strong>Ownership</strong> <strong>of</strong> <strong>Rail</strong> <strong>Signalling</strong> <strong>Systems</strong><br />
10<br />
For example, take the testing <strong>of</strong> a new track<br />
circuit within a signalling system. Testing is<br />
made up <strong>of</strong> services such as the cost <strong>of</strong> an<br />
engineer, which would be associated with<br />
the track circuit component which in turn<br />
is part <strong>of</strong> the signalling solution.<br />
Each cost is then categorised in two ways:<br />
• “People” or “fact” costs – as above, the cost is<br />
attributed to either labour related or specifi c,<br />
fact cost, refer to Figure 3<br />
• TCO stages – each cost is also attributed to<br />
a TCO life stage<br />
Figure 3: cost types covered in the TCO model<br />
People costs<br />
• Signal design engineers<br />
• Field Engineers<br />
• Signallers (where relevant)<br />
• Installation Team<br />
• Testing Team<br />
• Commissioning Team<br />
• Field inspectors<br />
• Field maintenance<br />
Fact costs<br />
• Design materials<br />
• Trackside hardware<br />
• Communications<br />
• Interlocking rooms/ housings<br />
• Control Centres<br />
• Test costs<br />
• Training materials<br />
• Spares<br />
• Energy (including heat, light, air conditioning)<br />
• Penalty payments (where relevant)<br />
• Renewal materials<br />
TCO life stage and cost drivers<br />
Setup<br />
This stage covers initial conceptualisation,<br />
business case creation, commercial arrangements<br />
and tendering. The driver <strong>of</strong> cost is man days<br />
required times day rate.<br />
Management<br />
Most signalling work will require a team dedicated<br />
to programme management. Initial estimates<br />
indicate that about half <strong>of</strong> this team is made up<br />
<strong>of</strong> specialist programme support; however this<br />
does differ largely by operator. <strong>Cost</strong>s are<br />
calculated as man days times day rate.<br />
Design<br />
The design will cover circuits and data design as<br />
well as operational system design for re-signalling<br />
an existing route. Estimates indicate that about two<br />
thirds <strong>of</strong> design work is completed by specialist<br />
signalling design houses. As above, man days are<br />
used to calculate costs.<br />
Acquisition<br />
This is principally signalling equipment,<br />
construction and materials. We asked<br />
participants to provide costs for re-signalling<br />
an existing route to exclude the costs for<br />
major civil works or communications network<br />
installation. It is based on the fi nal cost to the<br />
operator <strong>of</strong> equipment, as well as any labour<br />
costs required for obtaining the materials.<br />
We have used costs provided by estimating<br />
teams. Given the specifi city <strong>of</strong> operator needs,<br />
vendor solutions are <strong>of</strong>ten custom designed.<br />
Installation<br />
Installation costs are driven by man days <strong>of</strong> internal<br />
and external labour. A further consideration,<br />
though not always assigned a fi nancial cost,<br />
is possession duration which affects network<br />
availability while re-signalling work is performed.<br />
Testing<br />
Once installed, the system must be thoroughly<br />
tested before commissioning. A signifi cant<br />
proportion <strong>of</strong> this work tends to be performed<br />
by external contractors, and costs are calculated<br />
in the model by man days required.<br />
Commissioning<br />
A similar level <strong>of</strong> external expertise is required for<br />
commissioning, a man day rate and number <strong>of</strong><br />
days drives the cost.<br />
Operations<br />
The primary driver <strong>of</strong> operational cost is power<br />
consumption. This is determined using the<br />
following formula for each component <strong>of</strong> the<br />
signalling system: Component power cost<br />
= number <strong>of</strong> components* operating hours*<br />
power rating* cost per KwH<br />
Planned maintenance<br />
The amount <strong>of</strong> planned or preventative maintenance<br />
required for each component is determined topdown<br />
based on the number <strong>of</strong> engineers and a<br />
cost per head. We’ve also triangulated this based<br />
on a bottom-up method: Planned maintenance<br />
cost = number <strong>of</strong> components* inspection<br />
frequency* inspection duration (including<br />
travel time)* number <strong>of</strong> engineers performing<br />
inspection* cost per engineer hour<br />
Reactive maintenance<br />
Reactive maintenance refers to unscheduled<br />
repairs arising from faults that require engineer<br />
callouts. Again this was estimated top down based<br />
on the number <strong>of</strong> engineers in the maintenance<br />
team, proportion <strong>of</strong> time spent on reactive<br />
maintenance and a cost per head. We’ve also<br />
triangulated this based on a bottom-up method:<br />
Reactive maintenance cost = number <strong>of</strong> faults<br />
per annum by component type* fault response<br />
time (including travel time)* number <strong>of</strong> engineers<br />
present* cost per engineer hour<br />
Figure 4: TCO life stages<br />
Set up &<br />
management<br />
Design Acquisition Installation<br />
• Key TCO stages analysed • Analysed where relevant<br />
<strong>Total</strong> <strong>Cost</strong> <strong>of</strong> <strong>Ownership</strong> <strong>of</strong> <strong>Rail</strong> <strong>Signalling</strong> <strong>Systems</strong><br />
Delay penalty charges<br />
Most operators in this study do not have penalty<br />
charges levied by the regulator or train operating<br />
companies for service interruptions caused by a<br />
signalling fault. Penalties tend to depend on the<br />
industry structure – where the rail infrastructure<br />
operator is run by an entirely separate company<br />
to the train operating company (not just a different<br />
subsidiary within the same group), some form <strong>of</strong><br />
penalty is not unusual. Where the rail industry is<br />
vertically integrated, penalties are rare but so are<br />
other forms <strong>of</strong> incentive to improve performance.<br />
We think penalties should be considered as part<br />
<strong>of</strong> the TCO analysis, where the regulatory regime<br />
does charge them, we have estimated them as:<br />
Delay penalty cost = total delay minutes due to<br />
signalling* cost per delay minute<br />
Figure 4 below outlines the various stages that were<br />
considered in the total cost <strong>of</strong> ownership analysis.<br />
I300203_<strong>Invensys</strong>_<strong>Cost</strong>Of<strong>Ownership</strong>_WhitePaper.indd 10-11 13/04/2010 15:11<br />
Testing &<br />
commissioning<br />
Operations<br />
Planned<br />
Maintenance<br />
Reactive<br />
Maintenance<br />
Delay<br />
penalties<br />
11
<strong>Total</strong> <strong>Cost</strong> <strong>of</strong> <strong>Ownership</strong> <strong>of</strong> <strong>Rail</strong> <strong>Signalling</strong> <strong>Systems</strong> <strong>Total</strong> <strong>Cost</strong> <strong>of</strong> <strong>Ownership</strong> <strong>of</strong> <strong>Rail</strong> <strong>Signalling</strong> <strong>Systems</strong><br />
12<br />
Finding 1:<br />
The largest component <strong>of</strong> TCO is<br />
the initial implementation cost<br />
Our analysis <strong>of</strong> TCO indicates<br />
that the largest proportion<br />
<strong>of</strong> costs in a signalling system<br />
– 60% <strong>of</strong> the cost over 20<br />
years – is consumed during<br />
year 1 when the system is<br />
implemented. These costs<br />
cover design, acquisition <strong>of</strong><br />
equipment and construction,<br />
installation, testing and<br />
commissioning. The<br />
implementation costs are<br />
for a major signalling upgrade<br />
and therefore would use<br />
existing trackside housing<br />
and communications.<br />
This compares with 40% <strong>of</strong> TCO costs that are<br />
ongoing over the 20 years lifetime. They include<br />
the cost <strong>of</strong> maintenance both planned and<br />
reactive and operating costs, principally energy<br />
consumption by signalling equipment (this would<br />
also include air conditioning <strong>of</strong> signal housings).<br />
We have normalised our fi ndings for track<br />
confi guration and labour costs and present in<br />
Figure 5 the distribution <strong>of</strong> TCO costs expressed<br />
as an average <strong>of</strong> the participants in the study.<br />
We elaborate on the differences between<br />
operators below. But one thing stands out as<br />
consistent; the TCO over 20 years is approximately<br />
$67m for the 30km baseline section <strong>of</strong> track at<br />
each operator. This was surprising given the<br />
diversity <strong>of</strong> each operator’s situation but it points<br />
to a handy rule <strong>of</strong> thumb – the signalling TCO<br />
per km <strong>of</strong> route is $2.2m. We would expect this<br />
fi gure to be lower for predominantly freight-based<br />
routes where the signalling requirements would<br />
be much simpler.<br />
Variances between operators<br />
The ratio <strong>of</strong> ongoing to year 1 costs varies notably<br />
between operators. The most notable variations<br />
by life stage are listed below. We indicate the<br />
drivers that are likely to account for a material<br />
proportion <strong>of</strong> the variance in Figure 6.<br />
“ the TCO over 20 years<br />
is approximately $67m<br />
for the 30km baseline<br />
section <strong>of</strong> track<br />
at each operator.”<br />
Figure 5: Lifetime cost 1 (TCO) vs Year 1 costs for a 30km section <strong>of</strong> railway<br />
<strong>Total</strong> <strong>Cost</strong>, US$ Millions<br />
$70<br />
$60<br />
$50<br />
$40<br />
$30<br />
$20<br />
$10<br />
$0<br />
$67m<br />
Reactive Maintenance<br />
Planned Maintenance<br />
Operation<br />
Contingency<br />
Test + commission<br />
Design<br />
Install<br />
Acquisition<br />
20 Year <strong>Cost</strong><br />
Figure 6: Life stage cost variances between operators<br />
$42m<br />
Contingency<br />
Test + commission<br />
Design<br />
Install<br />
Acquisition<br />
Year 1 <strong>Cost</strong><br />
Source: Average across Operators A and B<br />
1: The lifetime <strong>of</strong> the signalling system has been taken to be 20 years, this is effectively the <strong>Total</strong> <strong>Cost</strong> <strong>of</strong> <strong>Ownership</strong>.<br />
% <strong>of</strong> TCO by lifestage<br />
Highest Lowest Drivers <strong>of</strong> variance<br />
Ratio <strong>of</strong> ongoing:<br />
Year 1 costs =<br />
1:1.5<br />
Design 12% 3% Extensive planning, management <strong>of</strong> internal / external partners<br />
and emphasis on preliminary designs<br />
Acquisition 32% 17% Different equipment vendors; more complexity in signalling scheme<br />
Install 18% 18% Minimal variance<br />
Test + Commission 9% 5% Marginal variance<br />
Contingency 10% 6% Normalised at 15% <strong>of</strong> design-commissioning cost<br />
Operation 7% 7% Energy price per kWh varies by country<br />
Preventative maintenance 41% 13% Local safety regulations can demand a greater number <strong>of</strong> inspections<br />
Reactive maintenance 5% 2% Fault frequency can be reduced as a result <strong>of</strong> more frequent<br />
inspections or better quality <strong>of</strong> installation<br />
I300203_<strong>Invensys</strong>_<strong>Cost</strong>Of<strong>Ownership</strong>_WhitePaper.indd 12-13 13/04/2010 15:11<br />
Ongoing<br />
costs 40%<br />
Year 1<br />
costs 60%<br />
13
<strong>Total</strong> <strong>Cost</strong> <strong>of</strong> <strong>Ownership</strong> <strong>of</strong> <strong>Rail</strong> <strong>Signalling</strong> <strong>Systems</strong> <strong>Total</strong> <strong>Cost</strong> <strong>of</strong> <strong>Ownership</strong> <strong>of</strong> <strong>Rail</strong> <strong>Signalling</strong> <strong>Systems</strong><br />
14<br />
Comparisons with telecoms<br />
The relative proportion <strong>of</strong> implementation to<br />
ongoing costs is useful to contrast against other<br />
industries. The telecoms industry has some relevant<br />
parallels to rail signalling: high infrastructure<br />
availability levels are critical, the industry is regulated,<br />
it’s technology intensive, the infrastructure is<br />
distributed and combines physical assets and<br />
computer processing, the asset owners are being<br />
driven to deliver effi ciencies. This last point has<br />
been more marked in telecoms companies as<br />
most are publicly held and shareholder infl uence<br />
encourages more radical thinking than a<br />
benevolent state owner.<br />
There’s one key message from the data in Figure 7<br />
– implementation costs are almost double in rail<br />
compared to telecoms.<br />
The disparity is partly down to differences in<br />
technology between the two industries. The<br />
modularity <strong>of</strong> design and open interfaces that<br />
can be found in telecoms does not yet exist in<br />
rail. In telecoms, this has driven innovation and<br />
a lot <strong>of</strong> competition which has seen equipment<br />
prices tumble. So much so, equipment vendors<br />
are expanding into services as they see their<br />
equipment sales being eroded by competitors<br />
from lower cost economies.<br />
Another difference between the two industries<br />
is that the telecoms equipment market is much<br />
bigger than the signalling market and the turnover<br />
<strong>of</strong> equipment is more rapid – equipment lifecycles<br />
are 10-20 years in telecoms rather than 20-30 years<br />
in rail. This makes innovation pay <strong>of</strong>f in telecoms.<br />
<strong>Signalling</strong> vendors on the other hand are<br />
constrained by unique country signalling rules<br />
which limit their ability to recoup development<br />
costs across multiple clients. Further there<br />
has been less demand for open interfaces as<br />
operators tend to allocate vendors to a particular<br />
geographic region or route.<br />
Figure 7: Comparison <strong>of</strong> TCO split in rail vs telecoms<br />
Split <strong>of</strong> TCO<br />
$100<br />
$80<br />
$60<br />
$40<br />
$20<br />
$0<br />
40%<br />
60%<br />
<strong>Rail</strong><br />
Source: Credo analysis<br />
1 : 1.5 2 : 1<br />
66%<br />
33%<br />
Telecoms<br />
Ratio <strong>of</strong> ongoing:<br />
year 1 costs<br />
Ongoing cost<br />
Year 1 cost<br />
ERTMS heralds a step change in the industry<br />
and should help the signalling market open<br />
up. Standards are, for the fi rst time, common<br />
across nations for ERTMS signalling. This should<br />
mean the associated technology becomes<br />
standardised and simpler too. But ERTMS is not<br />
a mature technology in terms <strong>of</strong> uptake. We<br />
notice that many operators have done trials or<br />
are making tentative moves to implement ERTMS<br />
in part <strong>of</strong> their network. There’s quite a way to go<br />
before we reach a universally common signalling<br />
platform that allows equipment vendors to<br />
achieve the scale economies that we see in other<br />
technology-driven industries<br />
Better performance<br />
through greater planned<br />
maintenance intensity?<br />
The single largest variance between Operator<br />
A and Operator B in Figure 8 is the remarkably<br />
higher proportion <strong>of</strong> costs spent on planned<br />
maintenance at B. In absolute terms, B spends<br />
over twice as much on maintenance as A. Why<br />
might that be?<br />
The principal reason is the more onerous inspection<br />
regime at Operator B (mandated through safety<br />
regulations) that require inspections to take<br />
place at a specifi ed frequency. Unlike in other<br />
countries, these regulations are set and audited<br />
by the regulator, the inspection regime is not at<br />
the discretion <strong>of</strong> the operator. Falling behind on<br />
inspections is not an option.<br />
But does twice the cost equals better reliability?<br />
To answer the question, we’ve looked at the<br />
number <strong>of</strong> delay minutes resulting from signalling<br />
faults, refer to Figure 8. The answer, superfi cially,<br />
appears to be yes, a doubling <strong>of</strong> maintenance<br />
costs at Operator B (ostensibly planned<br />
maintenance) is associated with delay minutes<br />
that are one-tenth the amount at Operator A.<br />
That is a remarkable performance difference.<br />
But we note the reduction in delay minutes is not<br />
solely attributable to more intensive maintenance<br />
– a harsher environment and greater signalling<br />
complexity are likely to account for a higher<br />
number <strong>of</strong> faults at Operator A.<br />
Figure 8: The relationship between maintenance<br />
cost and delay minutes<br />
Operator Operator Operator<br />
B A B / A<br />
<strong>Total</strong> delay mins pa 776 5,550 0.1<br />
<strong>Total</strong> maintenance<br />
cost pa<br />
$1,100,000 $460,000 2.4<br />
Source: Operator A, Operator B data for a 30km baseline route<br />
Finding 2:<br />
Labour is the main cost driver<br />
A closer look at the drivers <strong>of</strong><br />
cost reveals that the railway<br />
signalling is a manpower heavy<br />
activity – nearly half the costs<br />
are related to labour, refer to<br />
Figure 9. This is a combination<br />
<strong>of</strong> internal staff (30% <strong>of</strong> TCO)<br />
and external resources (19% <strong>of</strong><br />
TCO) used for signalling design,<br />
installation or testing.<br />
Our main observation is the degree to which<br />
operators have embraced the use <strong>of</strong> external<br />
resources for installation. Where skills are<br />
scarce or have low utilisation it is normal to use<br />
external resources – activities such as design,<br />
testing and commissioning are <strong>of</strong>ten outsourced.<br />
Less widespread is the use <strong>of</strong> external resource<br />
for installation which is the second most<br />
labour-intensive life stage after maintenance.<br />
Attitudes vary between operators on the use<br />
<strong>of</strong> external resource.<br />
In the UK, the approach has been to outsource<br />
installation (signal renewals) as it is an infrequent<br />
task and using external labour, albeit at higher<br />
rates, gives the operator higher labour force<br />
utilisation and greater flexibility.<br />
Figure 9: TCO by life stage and cost type<br />
Distribution <strong>of</strong> life stage cost by cost type<br />
100%<br />
90%<br />
80%<br />
70%<br />
60%<br />
50%<br />
40%<br />
30%<br />
20%<br />
10%<br />
0%<br />
0% 20% 40% 60% 80% 100%<br />
Source: Average across Operators A and B<br />
• Other, 26%<br />
Equipment, 25%<br />
•<br />
•<br />
•<br />
External Labour, 19%<br />
Internal Labour, 30%<br />
I300203_<strong>Invensys</strong>_<strong>Cost</strong>Of<strong>Ownership</strong>_WhitePaper.indd 14-15 13/04/2010 15:11<br />
Design<br />
Acquisition<br />
Installation<br />
Test + commission<br />
Contingency<br />
Operation<br />
Planned Maintenance<br />
Reactive Maintenance<br />
<strong>Total</strong>: $67m<br />
TCO life stage<br />
as a % <strong>of</strong> total cost
<strong>Total</strong> <strong>Cost</strong> <strong>of</strong> <strong>Ownership</strong> <strong>of</strong> <strong>Rail</strong> <strong>Signalling</strong> <strong>Systems</strong> <strong>Total</strong> <strong>Cost</strong> <strong>of</strong> <strong>Ownership</strong> <strong>of</strong> <strong>Rail</strong> <strong>Signalling</strong> <strong>Systems</strong><br />
16<br />
Finding 3:<br />
Technology use and engineer<br />
motivation markedly improves<br />
failure rates<br />
Once the signalling system<br />
is in place, the focus switches<br />
to performance. Performance<br />
is a measure <strong>of</strong> reliability<br />
and delays to passenger<br />
journeys. Three out <strong>of</strong> four<br />
<strong>of</strong> the operators in this study<br />
describe themselves as capacity<br />
constrained particularly during<br />
peak hours <strong>of</strong> commuter<br />
traffi c. Delays caused during<br />
these periods have far<br />
reaching consequences.<br />
“ Between 2003/04<br />
and 2006/07 there<br />
was a 44% reduction in<br />
the number <strong>of</strong> failures<br />
across the network.”<br />
The cost <strong>of</strong> delays<br />
The cost <strong>of</strong> delays is threefold:<br />
1 Bad press is never a good thing in rail; with<br />
a public image to protect and a passenger<br />
charter to uphold, most operators prefer to<br />
remain out <strong>of</strong> the newspaper headlines and away<br />
from political scrutiny<br />
2 Revenue deterioration is a real consequence if<br />
customers have alternative modes <strong>of</strong> transport<br />
they can resort to rather than rail. There is<br />
evidence to suggest that passengers value<br />
certainty <strong>of</strong> journey time over the actual journey<br />
time – the message is deliver on your promise<br />
3 Financial penalties. At some operators there<br />
is a real fi nancial cost associated with delays<br />
which can be as much as US $80 per minute <strong>of</strong><br />
delay. These are effectively penalty charges that<br />
are levied by the train operator or regulator for<br />
delays caused by infrastructure performance.<br />
Penalty regimes are not commonplace and<br />
some would argue that penalties are perverse<br />
instruments as they reduce the money available<br />
for maintenance and renewals work. A further<br />
cost, though not explicitly measured, is the<br />
increased burden <strong>of</strong> reactive maintenance –<br />
more delays, more callouts, more engineers<br />
required, more cost<br />
Reducing delays<br />
through motivation<br />
Operator B performs their maintenance activity<br />
in-house and for many years performance had<br />
languished. A performance management expert<br />
was hired from outside the rail industry and<br />
one <strong>of</strong> the fi rst things that he did was begin<br />
measuring performance at a more detailed level.<br />
Realising that accountability for performance<br />
lay in the hands <strong>of</strong> the maintenance managers<br />
and their crews, he began disseminating this<br />
information downwards rather than just upwards<br />
Figure 10: Reduction in signal failures after introducing motivational measures<br />
2003/4 2004/5 2005/6 2006/7<br />
to senior management. Crucially, he gathered<br />
data by maintenance crews (responsible for a<br />
particular region) and published the results to<br />
compare performance by region.<br />
The effect was startling, between 2003/04 and<br />
2006/07 there was a 44% reduction in the number<br />
<strong>of</strong> failures across the network, refer to Figure 11.<br />
The reduction was attributable to competition<br />
between crews keen to better than their peers,<br />
changing behaviours is a powerful force.<br />
I300203_<strong>Invensys</strong>_<strong>Cost</strong>Of<strong>Ownership</strong>_WhitePaper.indd 16-17 13/04/2010 15:11<br />
Number <strong>of</strong> annual failures<br />
3500<br />
3000<br />
2500<br />
2000<br />
1500<br />
1000<br />
500<br />
0<br />
Source: Operator B<br />
44%<br />
<strong>Signalling</strong><br />
Points<br />
Track circuits<br />
17
<strong>Total</strong> <strong>Cost</strong> <strong>of</strong> <strong>Ownership</strong> <strong>of</strong> <strong>Rail</strong> <strong>Signalling</strong> <strong>Systems</strong> <strong>Total</strong> <strong>Cost</strong> <strong>of</strong> <strong>Ownership</strong> <strong>of</strong> <strong>Rail</strong> <strong>Signalling</strong> <strong>Systems</strong><br />
18<br />
Lessons from field<br />
engineer motivation:<br />
• Making field engineers accountable for<br />
performance is empowering. Field engineers<br />
need to feel their efforts have consequences<br />
both good (appealing to pride) and bad<br />
(appealing to competitiveness).<br />
• Monthly progress updates motivates continued<br />
effort. The pressure needs to be kept on.<br />
• Comparisons encourage collaboration between<br />
crews this leads to innovation (in protocols and<br />
regimes) and faster/ more effective problem<br />
resolution. Engineers are naturally curious folk<br />
and have an appetite to learn.<br />
• Discretion to use minor capital works budgets.<br />
The maintenance crews were given flexibility on<br />
how best they could use a fixed capital budget.<br />
This meant they had to think smartly about how<br />
they used this resource – for tools, signalling<br />
cards, or even better transport to get to site.<br />
• Financial incentives can provide a further boost<br />
to performance improvement. After a while,<br />
3 years at Operator B, failure rate improvement<br />
slowed down. This is partly because there is a<br />
natural limit to the level <strong>of</strong> improvement from<br />
doing things consistently well. But possibly<br />
also because pride and competitiveness<br />
can only be leveraged so far. The team at<br />
Operator B is in the process <strong>of</strong> designing a<br />
better compensation system that will reward<br />
improved performance, this will hopefully help<br />
to sustain the journey <strong>of</strong> improvement.<br />
Figure 11: Reduction in signalling failures after<br />
a 3-pronged solution<br />
Number <strong>of</strong> annual failures<br />
600<br />
500<br />
400<br />
300<br />
200<br />
100<br />
0<br />
Source: Operator C<br />
Reducing delays<br />
through technology<br />
2005 2006 2007 2008 2009<br />
Operator C implemented a series <strong>of</strong> measures<br />
to reduce delays on one <strong>of</strong> their worst-performing<br />
metro routes. The route was under five years old<br />
and had failed to attract the passenger ridership<br />
that it was designed to take. This had not been<br />
helped by the poor reputation that the route<br />
had developed for being unreliable.<br />
The solution Operator C implemented was<br />
led by engineering and involved three steps.<br />
The first step was to improve resilience and<br />
iron out teething problems with the original<br />
implementation – additional power supplies,<br />
hardware and a s<strong>of</strong>tware refresh. The second<br />
step was to make more <strong>of</strong> their engineers<br />
available during peak hours to resolve failures.<br />
The final step was to introduce asset condition<br />
monitoring to alert field engineers to potential<br />
failures before they occurred, an early warning<br />
system. They decided to trial the solution first.<br />
The condition monitoring sensors were retro-fitted<br />
to existing components. The engineers focused<br />
on the most critical components for the trial:<br />
those that were hard to reach, exposed to<br />
lightning strikes or intensely used. This allowed<br />
them to limit the scope <strong>of</strong> the trial and take<br />
maximum advantage <strong>of</strong> the benefits.<br />
Early indications are positive; see chart 12 –<br />
failures have declined dramatically since 2005.<br />
The operator confirms that the 3-pronged<br />
approach has reduced the number <strong>of</strong> delays<br />
affecting passengers. It has helped to increase<br />
ridership on the line which Operator C, who<br />
also operates the trains, is delighted with.<br />
95%<br />
Step 1: S<strong>of</strong>tware fixes<br />
and resolution <strong>of</strong><br />
teething problems<br />
Step 2 & 3:<br />
Condition based<br />
monitoring and<br />
improved monitoring<br />
and improved<br />
engineer response<br />
Key facts: condition-based<br />
monitoring technologies<br />
• A concept that is widespread in process<br />
industries such petrol refining where the<br />
impact <strong>of</strong> a failed component can halt<br />
production or create a safety hazard, both<br />
<strong>of</strong> which entail significant cost<br />
• The concept exploits the fact that any<br />
electrical component can communicate<br />
information about its status (current, vibration,<br />
temperature, the number <strong>of</strong> operations<br />
performed etc) that can be used to predict<br />
imminent failure, indicate operation beyond<br />
expected norms or can simply isolate a<br />
component that has already failed. The status<br />
signals can be fed back to a control centre that<br />
monitors unusual patterns and alerts engineers<br />
to intervene even sometimes before the<br />
component has failed<br />
• For example, points are prone to failure as<br />
they have moving parts. If a set <strong>of</strong> points starts<br />
to operate slower, or draw more current,<br />
performance trends can be computed to<br />
indicate an imminent fault. This can create<br />
a failure log for the maintenance crew to be<br />
called out with an appropriate level <strong>of</strong> priority<br />
• A simpler approach to condition-based<br />
monitoring is to simply record the number<br />
<strong>of</strong> operations an asset has experienced. For<br />
example, the number <strong>of</strong> trains that have passed<br />
over it. Linking this usage data with statistical<br />
data that can predict when a particular asset is<br />
most likely to fail, allows engineers to intervene<br />
ahead <strong>of</strong> actual failures. This approach has the<br />
advantage <strong>of</strong> being simpler and less capital<br />
intensive as the implementation does not<br />
require sensors to be retro-fitted to assets<br />
• A powerful next step would be to link performance<br />
data to the asset register to provide an integrated<br />
view <strong>of</strong> asset performance. This can help uncover<br />
systemic issues. For example, recurring failures<br />
isolated to a single component could point<br />
to an issue that goes beyond the component,<br />
possibly related to the track configuration or<br />
environmental factors.<br />
• Condition-based monitoring points to a new<br />
approach to maintenance – one that is driven<br />
by focussed intervention rather than routine<br />
inspections. The concept is being embraced<br />
by the UK rail infrastructure owner as part <strong>of</strong><br />
its move to an ‘Intelligent Infrastructure’.<br />
Given the material cost <strong>of</strong> maintenance, in<br />
UK rail this is delivered by c.15,000 engineers,<br />
a smarter approach to maintenance could<br />
make a material impact on both reliability<br />
and operating costs.<br />
I300203_<strong>Invensys</strong>_<strong>Cost</strong>Of<strong>Ownership</strong>_WhitePaper.indd 18-19 13/04/2010 15:11<br />
19
<strong>Total</strong> <strong>Cost</strong> <strong>of</strong> <strong>Ownership</strong> <strong>of</strong> <strong>Rail</strong> <strong>Signalling</strong> <strong>Systems</strong> <strong>Total</strong> <strong>Cost</strong> <strong>of</strong> <strong>Ownership</strong> <strong>of</strong> <strong>Rail</strong> <strong>Signalling</strong> <strong>Systems</strong><br />
20<br />
Finding 4: Ideas big<br />
and small can reduce TCO<br />
In our meetings with operators,<br />
we met with representatives<br />
from various departments –<br />
engineering, procurement,<br />
design, performance, strategy<br />
& planning. Nearly all <strong>of</strong> them<br />
had ideas or examples for<br />
reducing TCO. This is the next<br />
logical step in the process<br />
once the distribution <strong>of</strong> costs<br />
across life stages and cost<br />
drivers are understood. The<br />
ideas ranged from simple ways<br />
to incrementally reduce failure<br />
rates, others required material<br />
capital investment.<br />
“ A further step to<br />
increase effi ciency and<br />
consistency would be<br />
to link maintenance<br />
regimes to components<br />
in the asset register ”<br />
We present a selection <strong>of</strong> the ideas for which<br />
there was existing evidence or where operators<br />
anticipated material savings to TCO. They affect<br />
different life stages and the onus <strong>of</strong> development<br />
or initiative is biased to either the operator or<br />
the signalling vendor.<br />
i. Modular equipment. Off-site assembly and<br />
testing <strong>of</strong> discrete signalling modules enables<br />
a more effi cient and robust approach to system<br />
testing. It also requires less time onsite thereby<br />
reducing disruption to the network and testing<br />
to be completed with fewer possessions (which<br />
is expensive as most <strong>of</strong> our operators were<br />
capacity constrained)<br />
ii. Handheld technology to de-skill/ improve<br />
quality <strong>of</strong> installation. Use <strong>of</strong> mobile handheld<br />
technology to run testing and commissioning<br />
scripts/ routines allows elements <strong>of</strong> the testing<br />
process to be de-skilled which in turn reduces<br />
reliance on scarce engineering resource and<br />
allows a more methodical and robust approach<br />
to installation. The latter point was particularly<br />
stressed by an operator who conceded that the<br />
quality <strong>of</strong> installation was one <strong>of</strong> the biggest<br />
sources <strong>of</strong> equipment failure<br />
iii. In situ component reliability shared with<br />
equipment vendor. There was a surprising lack<br />
<strong>of</strong> information sharing between operator and<br />
signalling vendor, at best this was done in an<br />
ad hoc fashion. Where the feedback loop was<br />
well-established, unsurprisingly there was better<br />
product performance. This was particularly<br />
important as a high proportion <strong>of</strong> failures tended<br />
to be traced to a small number <strong>of</strong> components<br />
that repeated failed<br />
iv. Condition-Based Maintenance (CBM).<br />
Early detection <strong>of</strong> potential component failure<br />
(components reporting issues themselves) allows<br />
maintenance resource to be prioritised by need<br />
rather than routine and failures to be avoided.<br />
There’s a less capital intensive approach to CBM<br />
that compares usage data against statistical data<br />
to predict failures, this may appeal to operators<br />
who have large networks that make the retr<strong>of</strong>i<br />
tting <strong>of</strong> sensors an unwieldy and expensive task<br />
v. Planned maintenance regimes that take<br />
into account the proximity <strong>of</strong> assets allow<br />
multiple components to be inspected during<br />
the same visit – this reduces travel time<br />
which can be equivalent to the time spent<br />
on an inspection. A further step to increase<br />
effi ciency and consistency would be to link<br />
maintenance regimes to components in the asset<br />
register which could in turn drive a workload<br />
management system. Engineers could then<br />
have their scheduled tasks downloaded to their<br />
handheld device and update the asset history on<br />
completion <strong>of</strong> the inspection.<br />
Idea Summary<br />
Figure 12<br />
Idea Life stage affected <strong>Cost</strong> Benefits<br />
i. Modular equipment Testing &<br />
commissioning<br />
ii. Handheld<br />
technology for<br />
installation<br />
iii. In situ component<br />
reliability<br />
iv. Condition-based<br />
maintenance<br />
v. Planned maintenance<br />
regimes<br />
vi. Handheld<br />
technology as<br />
a training tool<br />
Incremental improvements<br />
Other practical ideas put forward by operators<br />
that we believe are worthy <strong>of</strong> mention for their<br />
simplicity and pragmatism:<br />
• Replacing signal lamps LED versions that last<br />
up 20 times longer than traditional bulbs. This<br />
not only reduces the maintenance burden but<br />
consumes less energy.<br />
• Rationalising signal boxes and rooms to a fewer<br />
number <strong>of</strong> control rooms. At one operator, this<br />
resulted in 300 signal boxes being reduced<br />
to control centres with significant associated<br />
cost savings.<br />
vi. Handheld technology as a training tool.<br />
The diversity <strong>of</strong> signalling equipment that needs<br />
to be maintained by an engineer presents a<br />
training challenge. Handheld-based maintenance<br />
instructions (checklists) linked to an asset register<br />
which holds the component maintenance<br />
history allows faster fault resolution; improved<br />
proportion <strong>of</strong> fi rst time fi xes; and can reduce<br />
the reliance on classroom training. Another tool<br />
is visualisation, where engineers can train in<br />
simulated 3D environments, this has been used<br />
successfully in the oil and gas industry to allow<br />
engineers to practice in real-life situations<br />
Capex • Reduced trackside testing time<br />
• Standardised building blocks<br />
• Minimise network disruption/track access<br />
Installation Capex • Script-driven procedures improves quality <strong>of</strong> installation<br />
• Unit testing can be delegated to lower skilled engineers;<br />
reduces reliance on scarce resource<br />
Maintenance Minimal • Reduced failure rates<br />
• Improved component design<br />
Maintenance Capex • Failure rate improvement; delay avoidance<br />
• Reduced maintenance effort – intervention prioritised<br />
by need rather than periodic inspections<br />
Maintenance Minimal • Improved maintenance productivity<br />
(reduction <strong>of</strong> travel time)<br />
Maintenance Capex • Faster fault resolution; improved proportion <strong>of</strong> first<br />
time fixes<br />
• Maintenance history linked to asset record<br />
• Half life extension <strong>of</strong> interlocking cards every<br />
15yrs – to prolong life and reduce frequency <strong>of</strong><br />
faults prior to full life replacement every 25 – 30 yrs.<br />
Interlocking failures are <strong>of</strong>ten complex to<br />
resolve and can therefore cause long delays,<br />
this may not be cost effective but can certainly<br />
help avoid detrimental headlines complaining<br />
<strong>of</strong> long delays.<br />
I300203_<strong>Invensys</strong>_<strong>Cost</strong>Of<strong>Ownership</strong>_WhitePaper.indd 20-21 13/04/2010 15:11<br />
21
<strong>Total</strong> <strong>Cost</strong> <strong>of</strong> <strong>Ownership</strong> <strong>of</strong> <strong>Rail</strong> <strong>Signalling</strong> <strong>Systems</strong> <strong>Total</strong> <strong>Cost</strong> <strong>of</strong> <strong>Ownership</strong> <strong>of</strong> <strong>Rail</strong> <strong>Signalling</strong> <strong>Systems</strong><br />
22<br />
Thoughts for the future<br />
Finally, some thoughts from us based on<br />
observations in other industries that might be<br />
useful to consider for the the rail industry:<br />
• An appreciation <strong>of</strong> TCO opens up new ways<br />
<strong>of</strong> financing for major projects, as has been<br />
fairly commonplace for many years in both the<br />
telecoms and the aerospeace industries. As<br />
we have seen, on average 60% <strong>of</strong> a project’s<br />
lifetime cost occurs during the implementation<br />
phase, as a result many projects require a<br />
cashflow and investment pr<strong>of</strong>ile that mirrors<br />
this, namely a significant investment in the first<br />
few years. Unfortunately, for many operators,<br />
the full benefit <strong>of</strong> a new project, for example in<br />
terms <strong>of</strong> additional capacity, <strong>of</strong>ten only accrues<br />
a number <strong>of</strong> years into the operational phase.<br />
This delay in gaining the full benefit and a front<br />
loaded investment pr<strong>of</strong>ile can be a significant<br />
issue for stakeholders whose accountability and<br />
time horizons are <strong>of</strong>ten considerable shorter.<br />
• An alternative, illustrated in Figure 13 below,<br />
is to match the cashflow to the benefit pr<strong>of</strong>ile<br />
over both the implementation and operational<br />
phase. Aside from the obvious cashflow benefits,<br />
a longer term relationship between vendor<br />
and operator has a number <strong>of</strong> other benefits<br />
such as a better understanding <strong>of</strong> developing<br />
operational needs, improved maintenance<br />
and the enhancement and improvement <strong>of</strong><br />
equipment throughout its lifetime.<br />
Commercial alignment<br />
• Globalisation <strong>of</strong> trade and growing competition<br />
from rapidly developing economies has led<br />
to equipment price reductions, which on the<br />
surface at least, seem attractive to purchasers.<br />
Evidence from telecoms and the IT industries<br />
suggests it can be costly to focus on solely on<br />
purchase price at the expense <strong>of</strong> quality and<br />
robustness, issues which can occur many years<br />
after installation.<br />
• Greater vendor involvement during design.<br />
Early contractor involvement in design e.g.<br />
UK Highways and Defence procurement has<br />
been shown to reduce the cost <strong>of</strong> bidding for<br />
the vendors and helps the operator to arrive at<br />
better-priced solutions.<br />
Figure 13: Traditional V New Investment pr<strong>of</strong>i les<br />
90<br />
80<br />
70<br />
60<br />
50<br />
40<br />
30<br />
20<br />
10<br />
0<br />
Year 1 Year 2 Year 3 Year 4 Year 5 Year 6 Year 7 Year 8 Year 9 Year 10<br />
• “Contracting for performance”. This model<br />
exists for engines in the airline industry where<br />
the engine manufacturer not only provides<br />
the aircraft engine but provides an availability<br />
guarantee. The engine manufacturer is the<br />
exclusive maintainer in this highly controlled<br />
physical environment. A similar idea exists in<br />
fixed and mobile telecoms where a partner,<br />
usually an equipment vendor, is chosen and<br />
given responsibility for the whole equipment<br />
lifecycle typically 10-20 years. Everything but<br />
asset ownership is transferred to the partner<br />
under a long term performance-based contract.<br />
Both vendor involvement and contracting<br />
for performance drive efficiencies in asset<br />
management and improvements in asset<br />
availability. The involvement <strong>of</strong> an equipment<br />
vendor helps innovation and best practices from<br />
various operators to be disseminated across the<br />
industry. It also cuts across the silo mentality<br />
and competing objectives <strong>of</strong> departments e.g.<br />
procurement focus on price, engineering focus<br />
on functionality, maintenance focus on reliability.<br />
We recognise these ideas may have commercial<br />
or technical implications that may limit their<br />
suitability in the rail industry. However, they have<br />
helped transform the economics, efficiency,<br />
safety and reliability in aerospace and telecoms,<br />
there may be adaptations <strong>of</strong> these models that<br />
make them viable in rail.<br />
Capacity<br />
Traditional Investment pr<strong>of</strong>ile<br />
New Investment pr<strong>of</strong>ile<br />
I300203_<strong>Invensys</strong>_<strong>Cost</strong>Of<strong>Ownership</strong>_WhitePaper.indd 22-23 13/04/2010 15:11<br />
Notes
Tel: +44 (0)1249 441 049<br />
Email: rail.enquiries@invensysrail.com<br />
www.invensysrail.com<br />
<strong>Invensys</strong> <strong>Rail</strong> | PO Box 85 | Foundry Lane | Chippenham | Wiltshire | SN15 1RT UK<br />
© <strong>Invensys</strong> <strong>Rail</strong> 2010. All Rights reserved.<br />
Specifications subject to change.<br />
I300203_<strong>Invensys</strong>_<strong>Cost</strong>Of<strong>Ownership</strong>_WhitePaper.indd 24 13/04/2010 15:11