Total Cost of Ownership of Rail Signalling Systems ... - Invensys Rail
Total Cost of Ownership of Rail Signalling Systems ... - Invensys Rail
Total Cost of Ownership of Rail Signalling Systems ... - Invensys Rail

You also want an ePaper? Increase the reach of your titles
YUMPU automatically turns print PDFs into web optimized ePapers that Google loves.
<strong>Total</strong> <strong>Cost</strong> <strong>of</strong> <strong>Ownership</strong> <strong>of</strong> <strong>Rail</strong> <strong>Signalling</strong> <strong>Systems</strong> <strong>Total</strong> <strong>Cost</strong> <strong>of</strong> <strong>Ownership</strong> <strong>of</strong> <strong>Rail</strong> <strong>Signalling</strong> <strong>Systems</strong><br />
12<br />
Finding 1:<br />
The largest component <strong>of</strong> TCO is<br />
the initial implementation cost<br />
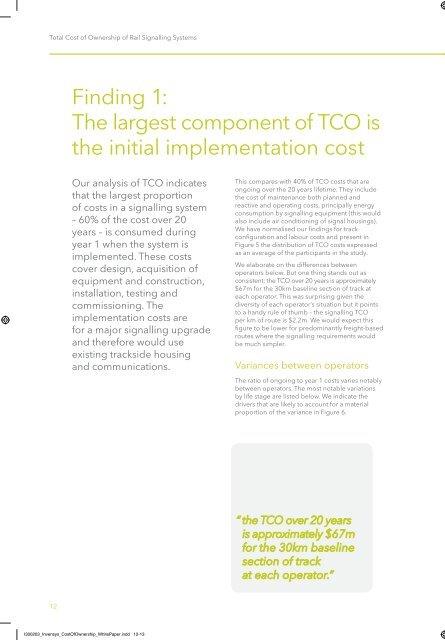
Our analysis <strong>of</strong> TCO indicates<br />
that the largest proportion<br />
<strong>of</strong> costs in a signalling system<br />
– 60% <strong>of</strong> the cost over 20<br />
years – is consumed during<br />
year 1 when the system is<br />
implemented. These costs<br />
cover design, acquisition <strong>of</strong><br />
equipment and construction,<br />
installation, testing and<br />
commissioning. The<br />
implementation costs are<br />
for a major signalling upgrade<br />
and therefore would use<br />
existing trackside housing<br />
and communications.<br />
This compares with 40% <strong>of</strong> TCO costs that are<br />
ongoing over the 20 years lifetime. They include<br />
the cost <strong>of</strong> maintenance both planned and<br />
reactive and operating costs, principally energy<br />
consumption by signalling equipment (this would<br />
also include air conditioning <strong>of</strong> signal housings).<br />
We have normalised our fi ndings for track<br />
confi guration and labour costs and present in<br />
Figure 5 the distribution <strong>of</strong> TCO costs expressed<br />
as an average <strong>of</strong> the participants in the study.<br />
We elaborate on the differences between<br />
operators below. But one thing stands out as<br />
consistent; the TCO over 20 years is approximately<br />
$67m for the 30km baseline section <strong>of</strong> track at<br />
each operator. This was surprising given the<br />
diversity <strong>of</strong> each operator’s situation but it points<br />
to a handy rule <strong>of</strong> thumb – the signalling TCO<br />
per km <strong>of</strong> route is $2.2m. We would expect this<br />
fi gure to be lower for predominantly freight-based<br />
routes where the signalling requirements would<br />
be much simpler.<br />
Variances between operators<br />
The ratio <strong>of</strong> ongoing to year 1 costs varies notably<br />
between operators. The most notable variations<br />
by life stage are listed below. We indicate the<br />
drivers that are likely to account for a material<br />
proportion <strong>of</strong> the variance in Figure 6.<br />
“ the TCO over 20 years<br />
is approximately $67m<br />
for the 30km baseline<br />
section <strong>of</strong> track<br />
at each operator.”<br />
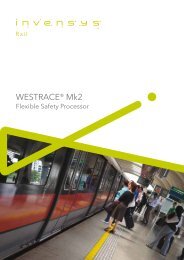
Figure 5: Lifetime cost 1 (TCO) vs Year 1 costs for a 30km section <strong>of</strong> railway<br />
<strong>Total</strong> <strong>Cost</strong>, US$ Millions<br />
$70<br />
$60<br />
$50<br />
$40<br />
$30<br />
$20<br />
$10<br />
$0<br />
$67m<br />
Reactive Maintenance<br />
Planned Maintenance<br />
Operation<br />
Contingency<br />
Test + commission<br />
Design<br />
Install<br />
Acquisition<br />
20 Year <strong>Cost</strong><br />
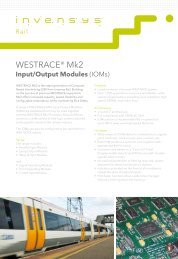
Figure 6: Life stage cost variances between operators<br />
$42m<br />
Contingency<br />
Test + commission<br />
Design<br />
Install<br />
Acquisition<br />
Year 1 <strong>Cost</strong><br />
Source: Average across Operators A and B<br />
1: The lifetime <strong>of</strong> the signalling system has been taken to be 20 years, this is effectively the <strong>Total</strong> <strong>Cost</strong> <strong>of</strong> <strong>Ownership</strong>.<br />
% <strong>of</strong> TCO by lifestage<br />
Highest Lowest Drivers <strong>of</strong> variance<br />
Ratio <strong>of</strong> ongoing:<br />
Year 1 costs =<br />
1:1.5<br />
Design 12% 3% Extensive planning, management <strong>of</strong> internal / external partners<br />
and emphasis on preliminary designs<br />
Acquisition 32% 17% Different equipment vendors; more complexity in signalling scheme<br />
Install 18% 18% Minimal variance<br />
Test + Commission 9% 5% Marginal variance<br />
Contingency 10% 6% Normalised at 15% <strong>of</strong> design-commissioning cost<br />
Operation 7% 7% Energy price per kWh varies by country<br />
Preventative maintenance 41% 13% Local safety regulations can demand a greater number <strong>of</strong> inspections<br />
Reactive maintenance 5% 2% Fault frequency can be reduced as a result <strong>of</strong> more frequent<br />
inspections or better quality <strong>of</strong> installation<br />
I300203_<strong>Invensys</strong>_<strong>Cost</strong>Of<strong>Ownership</strong>_WhitePaper.indd 12-13 13/04/2010 15:11<br />
Ongoing<br />
costs 40%<br />
Year 1<br />
costs 60%<br />
13