Annual Financial Statements 2008 of Bank Austria
Annual Financial Statements 2008 of Bank Austria
Annual Financial Statements 2008 of Bank Austria
You also want an ePaper? Increase the reach of your titles
YUMPU automatically turns print PDFs into web optimized ePapers that Google loves.
Consolidated <strong>Financial</strong> <strong>Statements</strong>: Management Report <strong>of</strong> the Group<br />
Management Report <strong>2008</strong> (cONTINUED)<br />
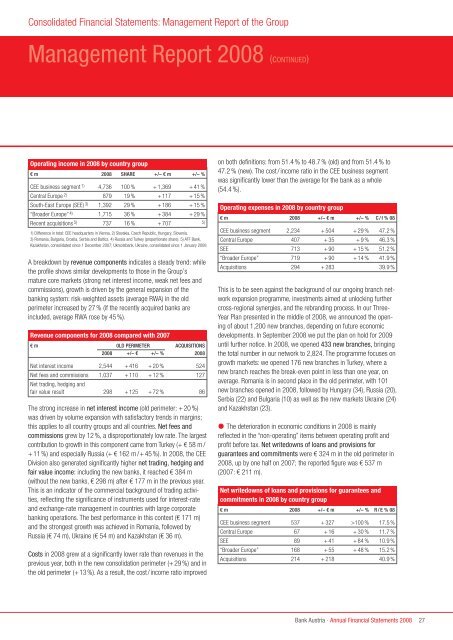
Operating income in <strong>2008</strong> by country group<br />
€ m <strong>2008</strong> SHARE +/– € m +/– %<br />
CEE business segment 1) 4,736 100 % + 1,369 + 41 %<br />
Central Europe 2) 879 19 % + 117 + 15 %<br />
South-East Europe (SEE) 3) 1,392 29 % + 186 + 15 %<br />
“Broader Europe” 4) 1,715 36 % + 384 + 29 %<br />
Recent acquisitions 5) 737 16 % + 707 5)<br />
1) Difference in total: CEE headquarters in Vienna. 2) Slovakia, Czech Republic, Hungary, Slovenia.<br />
3) Romania, Bulgaria, Croatia, Serbia and Baltics. 4) Russia and Turkey (proportionate share). 5) ATF <strong>Bank</strong>,<br />
Kazakhstan, consolidated since 1 December 2007; Ukrsotsbank, Ukraine, consolidated since 1 January <strong>2008</strong><br />
A breakdown by revenue components indicates a steady trend: while<br />
the pr<strong>of</strong>ile shows similar developments to those in the Group’s<br />
mature core markets (strong net interest income, weak net fees and<br />
commissions), growth is driven by the general expansion <strong>of</strong> the<br />
banking system: risk-weighted assets (average RWA) in the old<br />
perimeter increased by 27 % (if the recently acquired banks are<br />
included, average RWA rose by 45 %).<br />
Revenue components for <strong>2008</strong> compared with 2007<br />
€ m 0LD PERIMETER ACQUISITIONS<br />
<strong>2008</strong> +/– € +/– % <strong>2008</strong><br />
Net interest income 2,544 + 416 + 20 % 524<br />
Net fees and commissions<br />
Net trading, hedging and<br />
1,037 + 110 + 12 % 127<br />
fair value result 298 + 125 + 72 % 86<br />
The strong increase in net interest income (old perimeter: + 20 %)<br />
was driven by volume expansion with satisfactory trends in margins;<br />
this applies to all country groups and all countries. Net fees and<br />
commissions grew by 12 %, a disproportionately low rate. The largest<br />
contribution to growth in this component came from Turkey (+ € 58 m /<br />
+ 11 %) and especially Russia (+ € 162 m /+ 45 %). In <strong>2008</strong>, the CEE<br />
Division also generated significantly higher net trading, hedging and<br />
fair value income: including the new banks, it reached € 384 m<br />
(without the new banks, € 298 m) after € 177 m in the previous year.<br />
This is an indicator <strong>of</strong> the commercial background <strong>of</strong> trading activities,<br />
reflecting the significance <strong>of</strong> instruments used for interest-rate<br />
and exchange-rate management in countries with large corporate<br />
banking operations. The best performance in this context (€ 171 m)<br />
and the strongest growth was achieved in Romania, followed by<br />
Russia (€ 74 m), Ukraine (€ 54 m) and Kazakhstan (€ 36 m).<br />
Costs in <strong>2008</strong> grew at a significantly lower rate than revenues in the<br />
previous year, both in the new consolidation perimeter (+ 29 %) and in<br />
the old perimeter (+ 13 %). As a result, the cost / income ratio improved<br />
on both definitions: from 51.4 % to 48.7 % (old) and from 51.4 % to<br />
47.2 % (new). The cost / income ratio in the CEE business segment<br />
was significantly lower than the average for the bank as a whole<br />
(54.4 %).<br />
Operating expenses in <strong>2008</strong> by country group<br />
€ m <strong>2008</strong> +/– € m +/– % C / I % 08<br />
CEE business segment 2,234 + 504 + 29 % 47.2 %<br />
Central Europe 407 + 35 + 9 % 46.3 %<br />
SEE 713 + 90 + 15 % 51.2 %<br />
“Broader Europe” 719 + 90 + 14 % 41.9 %<br />
Acquisitions 294 + 283 39.9 %<br />
This is to be seen against the background <strong>of</strong> our ongoing branch network<br />
expansion programme, investments aimed at unlocking further<br />
cross-regional synergies, and the rebranding process. In our Three-<br />
Year Plan presented in the middle <strong>of</strong> <strong>2008</strong>, we announced the opening<br />
<strong>of</strong> about 1,200 new branches, depending on future economic<br />
developments. In September <strong>2008</strong> we put the plan on hold for 2009<br />
until further notice. In <strong>2008</strong>, we opened 433 new branches, bringing<br />
the total number in our network to 2,824. The programme focuses on<br />
growth markets: we opened 176 new branches in Turkey, where a<br />
new branch reaches the break-even point in less than one year, on<br />
average. Romania is in second place in the old perimeter, with 101<br />
new branches opened in <strong>2008</strong>, followed by Hungary (34), Russia (20),<br />
Serbia (22) and Bulgaria (10) as well as the new markets Ukraine (24)<br />
and Kazakhstan (23).<br />
� The deterioration in economic conditions in <strong>2008</strong> is mainly<br />
reflected in the “non-operating” items between operating pr<strong>of</strong>it and<br />
pr<strong>of</strong>it before tax. Net writedowns <strong>of</strong> loans and provisions for<br />
guarantees and commitments were € 324 m in the old perimeter in<br />
<strong>2008</strong>, up by one half on 2007; the reported figure was € 537 m<br />
(2007: € 211 m).<br />
Net writedowns <strong>of</strong> loans and provisions for guarantees and<br />
commitments in <strong>2008</strong> by country group<br />
€ m <strong>2008</strong> +/– € m +/– % R / E % 08<br />
CEE business segment 537 + 327 >100 % 17.5 %<br />
Central Europe 67 + 16 + 30 % 11.7 %<br />
SEE 89 + 41 + 84 % 10.9 %<br />
“Broader Europe” 168 + 55 + 48 % 15.2 %<br />
Acquisitions 214 + 218 40.9 %<br />
<strong>Bank</strong> <strong>Austria</strong> · <strong>Annual</strong> <strong>Financial</strong> <strong>Statements</strong> <strong>2008</strong><br />
27


