- Page 4:
To the memory of my father, Joseph,
- Page 8: This page intentionally left blank
- Page 12: 6.2 Symmetry about a Point 42Chapte
- Page 16: Chapter 18Rectilinear Motion and In
- Page 20: Chapter 32Applications of Integrati
- Page 24: This page intentionally left blank
- Page 28: 2 COORDINATE SYSTEMS ON A LINE[CHAP
- Page 32: ~ ~ ~4 COORDINATE SYSTEMS ON A LINE
- Page 38: CHAP. 11COORDINATE SYSTEMS ON A LIN
- Page 42: CHAP. 23COORDINATE SYSTEMS IN A PLA
- Page 46: CHAP. 21 COORDINATE SYSTEMS IN A PL
- Page 50: CHAP. 2) COORDINATE SYSTEMS IN A PL
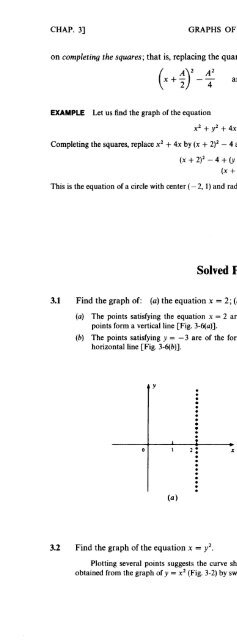
- Page 54: CHAP. 31GRAPHS OF EQUATIONS15T0 0-1
- Page 60: 18GRAPHS OF EQUATIONS3 -----4--,,-2
- Page 64: 20 GRAPHS OF EQUATIONS [CHAP. 33.6
- Page 68: 22GRAPHS OF EQUATIONS[CHAP. 33.10On
- Page 72: Chapter 4Straight Lines4.1 SLOPEIf
- Page 76: 26 STRAIGHT LINES [CHAP. 4f’Fig.
- Page 80: 28 STRAIGHT LINES [CHAP. 4Therefore
- Page 84: 30 STRAIGHT LINES [CHAP. 4Solve the
- Page 88: 32 STRAIGHT LINES [CHAP. 4Fig. 4-12
- Page 92: 34 STRAIGHT LINES [CHAP. 44.144.154
- Page 96: Chapter 5Intersections of GraphsThe
- Page 100: 38INTERSECTIONS OF GRAPHS [CHAP. 5S
- Page 104: 40 INTERSECTIONS OF GRAPHS [CHAP. 5
- Page 108:
42 SYMMETRY[CHAP. 6Consider the gra
- Page 112:
44 SYMMETRY [CHAP. 6(c) The line is
- Page 116:
Chapter 7Functions and Their Graphs
- Page 120:
48 FUNCTIONS AND THEIR GRAPHS[CHAP.
- Page 124:
50 FUNCTIONS AND THEIR GRAPHS [CHAP
- Page 128:
52 FUNCTIONS AND THEIR GRAPHS [CHAP
- Page 132:
54FUNCTIONS AND THEIR GRAPHS [CHAP.
- Page 136:
56 FUNCTIONS AND THEIR GRAPHS [CHAP
- Page 140:
58 FUNCTIONS AND THEIR GRAPHS [CHAP
- Page 144:
60 LIMITS [CHAP. 8PROPERTY 111.EXAM
- Page 148:
h,62 LIMITS [CHAP. 8Notice that the
- Page 152:
64 LIMITS[CHAP. 8tYII-t------IIII-I
- Page 156:
66LIMITS [CHAP. 88.10 (a)(b)x4 - 1F
- Page 160:
68 SPECIAL LIMITS [CHAP. 99.2 INFIN
- Page 164:
70 SPECIAL LIMITS [CHAP. 9x-2EXAMPL
- Page 168:
72 SPECIAL LIMITS [CHAP. 9EXAMPLE A
- Page 172:
74 SPECIAL LIMITS [CHAP. 9GENERAL R
- Page 176:
and76 SPECIAL LIMITS [CHAP. 9Supple
- Page 180:
Chapter 1010.1 DEFIMON AND PROPERTI
- Page 184:
80 CONTINUITY [CHAP. 10(b) The func
- Page 188:
82IYCONTINUITYI’[CHAP. 100I X 0 1
- Page 192:
84CONTINUITY[CHAP. 10YY0T'-3 -2 -1
- Page 196:
Chapter 11The Slope of a Tangent Li
- Page 200:
88 THE SLOPE OF A TANGENT LINE [CHA
- Page 204:
90 THE SLOPE OF A TANGENT LINE [CHA
- Page 208:
Chapter 12The expression for the sl
- Page 212:
TTHE DERIVATIVE [CHAP. 12EXAMPLESD,
- Page 216:
96 THE DERIVATIVE [CHAP. 12(b) Forf
- Page 220:
h,h,98 THE DERIVATIVE [CHAP. 12(b)
- Page 224:
100 MORE ON THE DERIVATIVE [CHAP. 1
- Page 228:
102 MORE ON THE DERIVATIVE [CHAP. 1
- Page 232:
Chapter 14Maximum and Minimum Probl
- Page 236:
106 MAXIMUM AND MINIMUM PROBLEMS [C
- Page 240:
108 MAXIMUM AND MINIMUM PROBLEMS [C
- Page 244:
110 MAXIMUM AND MINIMUM PROBLEMS [C
- Page 248:
112 MAXIMUM AND MINIMUM PROBLEMS [C
- Page 252:
0*1114 MAXIMUM AND MINIMUM PROBLEMS
- Page 256:
Chapter 15The Chain RulelS.lCOMPOSI
- Page 260:
118 THE CHAIN RULE [CHAP. 15EXAMPLE
- Page 264:
4)1)120 THE CHAIN RULE [CHAP. 15The
- Page 268:
122 THE CHAIN RULE [CHAP. 15The onl
- Page 272:
124 THE CHAIN RULE [CHAP. 1515.15 F
- Page 276:
Chapter 16Implicit DifferentiationA
- Page 280:
128 IMPLICIT DIFFERENTIATION[CHAP.
- Page 284:
130 THE MEAN-VALUE THEOREM AND THE
- Page 288:
132 THE MEAN-VALUE THEOREM AND THE
- Page 292:
134 THE MEAN-VALUE THEOREM AND THE
- Page 296:
Chapter 18Rectilinear Motion and In
- Page 300:
138 RECTILINEAR MOTION AND INSTANTA
- Page 304:
140 RECTILINEAR MOTION AND INSTANTA
- Page 308:
142 RECTILINEAR MOTION AND INSTANTA
- Page 312:
144 INSTANTANEOUS RATE OF CHANGE[CH
- Page 316:
146 INSTANTANEOUS RATE OF CHANGE [C
- Page 320:
148 RELATED RATES [CHAP. 20In Fig.
- Page 324:
150 RELATED RATES [CHAP. 20- XFig.
- Page 328:
152 RELATED RATES[CHAP. 20and, by (
- Page 332:
154 RELATED RATES [CHAP. 2020.21 A
- Page 336:
156 APPROXIMATION BY DIFFERENTIALS;
- Page 340:
158 APPROXIMATION BY DIFFERENTIALS;
- Page 344:
1 60APPROXIMATION BY DIFFERENTIALS;
- Page 348:
1 62 HIGHER-ORDER DERIVATIVES [CHAP
- Page 352:
~~164 HIGHER-ORDER DERIVATIVES [CHA
- Page 356:
166 HIGHER-ORDER DERIVATIVES [CHAP.
- Page 360:
168 THE SECOND DERIVATIVE AND GRAPH
- Page 364:
170 THE SECOND DERIVATIVE AND GRAPH
- Page 368:
172 THE SECOND DERIVATIVE AND GRAPH
- Page 372:
174 THE SECOND DERIVATIVE AND GRAPH
- Page 376:
23.7 If, for all x,f’(x) > 0 andf
- Page 380:
178 THE SECOND DERIVATIVE AND GRAPH
- Page 384:
180 MORE MAXIMUM AND MINIMUM PROBLE
- Page 388:
182 MORE MAXIMUM AND MINIMUM PROBLE
- Page 392:
184 MORE MAXIMUM AND MINIMUM PROBLE
- Page 396:
186 ANGLE MEASURE [CHAP. 25and so o
- Page 400:
188 ANGLE MEASURE [CHAP. 25Solved P
- Page 404:
Chapter 2626.1 GENERAL DEFINITIONSi
- Page 408:
192 SINE AND COSINE FUNCTIONS [CHAP
- Page 412:
194 SINE AND COSINE FUNCTIONS [CHAP
- Page 416:
~~~ ~196 SINE AND COSINE FUNCTIONS
- Page 420:
198 SINE AND COSINE FUNCTIONS [CHAP
- Page 424:
200 SINE AND COSINE FUNCTIONS [CHAP
- Page 428:
Chapter 27Graphs and Derivatives of
- Page 432:
204 GRAPHS AND DERIVATIVES OF SINE
- Page 436:
206 GRAPHS AND DERIVATIVES OF SINE
- Page 440:
208 GRAPHS AND DERIVATIVES OF SINE
- Page 444:
210 GRAPHS AND DERIVATIVES OF SINE
- Page 448:
212GRAPHS AND DERIVATIVES OF SINE A
- Page 452:
Chapter 28The Tangent andOther Trig
- Page 456:
216 THE TANGENT AND OTHER TRIGONOME
- Page 460:
218 THE TANGENT AND OTHER TRIGONOME
- Page 464:
220 THE TANGENT AND OTHER TRIGONOME
- Page 468:
222 ANTIDERIVATIVES [CHAP. 29EXAMPL
- Page 472:
224 ANTIDERIVATIVES [CHAP. 29(ii) F
- Page 476:
226 ANTIDERIVATIVES [CHAP. 2929.5 A
- Page 480:
228 ANTIDERIVATIVES [CHAP. 2929.13
- Page 484:
230 THE DEFINITE INTEGRAL [CHAP. 30
- Page 488:
232 THE DEFINITE INTEGRAL [CHAP. 30
- Page 492:
234 THE DEFINlTE INTEGRAL (CHAP.[I)
- Page 496:
’)236 THE DEFINITE INTEGRAL [CHAP
- Page 500:
Chapter 31The Fundamental Theorem o
- Page 504:
240 THE FUNDAMENTAL THEOREM OF CALC
- Page 508:
242 THE FUNDAMENTAL THEOREM OF CALC
- Page 512:
244 THE FUNDAMENTAL THEOREM OF CALC
- Page 516:
246 THE FUNDAMENTAL THEOREM OF CALC
- Page 520:
248 THE FUNDAMENTAL THEOREM OF CALC
- Page 524:
250 APPLICATlONS OF INTEGRATION I:
- Page 528:
252 APPLICATIONS OF INTEGRATION I:
- Page 532:
254 APPLICATIONS OF INTEGRATION I:
- Page 536:
256 APPLICATIONS OF INTEGRATION I:
- Page 540:
258 APPLlCATlONS OF INTEGRATION 11:
- Page 544:
260 APPLICATIONS OF INTEGRATION 11:
- Page 548:
262 APPLICATIONS OF INTEGRATION 11:
- Page 552:
264 APPLICATIONS OF INTEGRATION 11:
- Page 556:
266 APPLICATIONS OF INTEGRATION I1
- Page 560:
Chapter 3434.1 DEFlMTlONWe already
- Page 564:
270 THE NATURAL LOGARITHM [CHAP. 34
- Page 568:
272 THE NATURAL LOGARITHM [CHAP. 34
- Page 572:
(b)27434.14THE NATURAL LOGARITHM11(
- Page 576:
276 EXPONENTIAL FUNCTIONS [CHAP. 35
- Page 580:
278EXPONENTIAL FUNCTIONS[CHAP. 3535
- Page 584:
280 EXPONENTIAL FUNCTIONS [CHAP. 35
- Page 588:
282 EXPONENTIAL FUNCTIONS [CHAP. 35
- Page 592:
Chapter 36L’HGpital’s Rule ; Ex
- Page 596:
286 L'HOPITAL'S RULE; EXPONENTIAL G
- Page 600:
288 L'H~PITAL'S RULE; EXPONENTIAL G
- Page 604:
290 L'HQPITAL'S RULE; EXPONENTIAL G
- Page 608:
~~~~~~~~ ~ ~~~ ~ ~ ~ ~ ~ ~ ~Chapter
- Page 612:
294 INVERSE TRIGONOMETRIC FUNCTIONS
- Page 616:
296 INVERSE TRIGONOMETRIC FUNCTIONS
- Page 620:
298 INVERSE TRIGONOMETRIC FUNCTIONS
- Page 624:
300 INVERSE TRIGONOMETRIC FUNCTIONS
- Page 628:
302 INVERSE TRIGONOMETRIC FUNCTIONS
- Page 632:
above304 INVERSE TRIGONOMETRIC FUNC
- Page 636:
~ du=dx306 INTEGRATION BY PARTS [CH
- Page 640:
308 INTEGRATION BY PARTS[CHAP. 3838
- Page 644:
3 10INTEGRATION BY PARTS[CHAP. 38Su
- Page 648:
312 TRIGONOMETRIC INTEGRANDS AND TR
- Page 652:
314 TRIGONOMETRIC INTEGRANDS AND TR
- Page 656:
316 TRIGONOMETRIC INTEGRANDS AND TR
- Page 660:
318 TRIGONOMETRIC INTEGRANDS AND TR
- Page 664:
Chapter 40Integration of Rational F
- Page 668:
322 THE METHOD OF PARTIAL FRACTIONS
- Page 672:
324 THE METHOD OF PARTIAL FRACTIONS
- Page 676:
326 THE METHOD OF PARTIAL FRACTIONS
- Page 680:
328 THE METHOD OF PARTIAL FRACTIONS
- Page 684:
Appendix BBasic Integration Formula
- Page 688:
0"1"2"3"4"5"6"7"8"9"10"11"12"13"14"
- Page 692:
Appendix F-X0.000.050.100.150.200.2
- Page 696:
336 ANSWERS. TO SUPPLEMENTARY PROBL
- Page 700:
338ANSWERS TO SUPPLEMENTARY PROBLEM
- Page 704:
340 ANSWERS TO SUPPLEMENTARY PROBLE
- Page 708:
342 ANSWERS TO SUPPLEMENTARY PROBLE
- Page 712:
344 ANSWERS TO SUPPLEMENTARY PROBLE
- Page 716:
346 ANSWERS TO SUPPLEMENTARY PROBLE
- Page 720:
348 ANSWERS TO SUPPLEMENTARY PROBLE
- Page 724:
350 ANSWERS TO SUPPLEMENTARY PROBLE
- Page 728:
352 ANSWERS TO SUPPLEMENTARY PROBLE
- Page 732:
354 ANSWERS TO SUPPLEMENTARY PROBLE
- Page 736:
356 ANSWERS TO SUPPLEMENTARY PROBLE
- Page 740:
358 ANSWERS TO SUPPLEMENTARY PROBLE
- Page 744:
360 ANSWERS TO SUPPLEMENTARY PROBLE
- Page 748:
R-v QdA 1d 1
- Page 752:
364+I)ANSWERS TO SUPPLEM ENTARY PRO
- Page 756:
366 ANSWERS TO SUPPLEMENTARY PROBLE
- Page 760:
368 ANSWERS TO SUPPLEMENTARY PROBLE
- Page 764:
370 ANSWERS TO SUPPLEMENTARY PROBLE
- Page 768:
Collinear points, 30Common logarith
- Page 772:
Infinite limits, 68Inflection point
- Page 776:
RRadian, 185Radicals, 118Range, 47R