Wind resources at Horns Rev
Wind resources at Horns Rev
Wind resources at Horns Rev

Create successful ePaper yourself
Turn your PDF publications into a flip-book with our unique Google optimized e-Paper software.
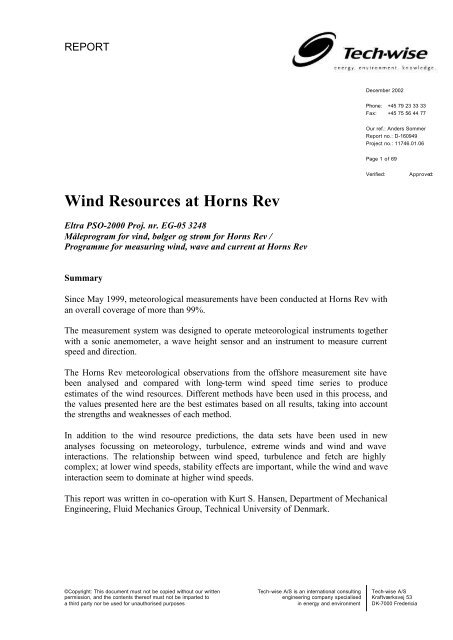
REPORT<br />
<strong>Wind</strong> Resources <strong>at</strong> <strong>Horns</strong> <strong>Rev</strong><br />
Eltra PSO-2000 Proj. nr. EG-05 3248<br />
Måleprogram for vind, bølger og strøm for <strong>Horns</strong> <strong>Rev</strong> /<br />
Programme for measuring wind, wave and current <strong>at</strong> <strong>Horns</strong> <strong>Rev</strong><br />
Summary<br />
December 2002<br />
Phone: +45 79 23 33 33<br />
Fax: +45 75 56 44 77<br />
Our ref.: Anders Sommer<br />
Report no.: D-160949<br />
Project no.: 11746.01.06<br />
Page 1 of 69<br />
Since May 1999, meteorological measurements have been conducted <strong>at</strong> <strong>Horns</strong> <strong>Rev</strong> with<br />
an overall coverage of more than 99%.<br />
The measurement system was designed to oper<strong>at</strong>e meteorological instruments together<br />
with a sonic anemometer, a wave height sensor and an instrument to measure current<br />
speed and direction.<br />
The <strong>Horns</strong> <strong>Rev</strong> meteorological observ<strong>at</strong>ions from the offshore measurement site have<br />
been analysed and compared with long-term wind speed time series to produce<br />
estim<strong>at</strong>es of the wind <strong>resources</strong>. Different methods have been used in this process, and<br />
the values presented here are the best estim<strong>at</strong>es based on all results, taking into account<br />
the strengths and weaknesses of each method.<br />
In addition to the wind resource predictions, the d<strong>at</strong>a sets have been used in new<br />
analyses focussing on meteorology, turbulence, extreme winds and wind and wave<br />
interactions. The rel<strong>at</strong>ionship between wind speed, turbulence and fetch are highly<br />
complex; <strong>at</strong> lower wind speeds, stability effects are important, while the wind and wave<br />
interaction seem to domin<strong>at</strong>e <strong>at</strong> higher wind speeds.<br />
This report was written in co-oper<strong>at</strong>ion with Kurt S. Hansen, Department of Mechanical<br />
Engineering, Fluid Mechanics Group, Technical University of Denmark.<br />
Verified: Approved:<br />
©Copyright: This document must not be copied without our written Tech-wise A/S is an intern<strong>at</strong>ional consulting Tech-wise A/S<br />
permission, and the contents thereof must not be imparted to engineering company specialised Kraftværksvej 53<br />
a third party nor be used for unauthorised purposes in energy and environment DK-7000 Fredericia
energy. environment. knowledge. Page 2 of 69<br />
Table of Contents<br />
1. SITE AND DATA ASSESSMENT......................................................................... 4<br />
1.1 SITE DESCRIPTION.............................................................................................. 4<br />
1.2 DESCRIPTION OF MEASUREMENTS SYSTEM ........................................................ 4<br />
1.2.1 Primary meteorological system ................................................................ 4<br />
1.2.2 Met back-up system................................................................................... 8<br />
1.2.3 Sonic system............................................................................................ 11<br />
1.3 QUALITY CONTROL.......................................................................................... 13<br />
1.3.1 Determin<strong>at</strong>ion of spikes.......................................................................... 13<br />
1.3.2 Determin<strong>at</strong>ion of signal drop-outs.......................................................... 14<br />
1.3.3 Determin<strong>at</strong>ion of signal st<strong>at</strong>ionarity....................................................... 14<br />
1.4 DATA OVERVIEW ............................................................................................. 15<br />
1.4.1 Directional sensitivity analysis............................................................... 15<br />
1.4.2 Primary met system................................................................................. 18<br />
1.4.3 Back-up met system................................................................................. 19<br />
1.4.4 Sonic system............................................................................................ 20<br />
2. STATISTICS .......................................................................................................... 20<br />
2.1 WIND SPEED AND TURBULENCE....................................................................... 20<br />
2.2 WIND DIRECTION ............................................................................................. 25<br />
2.3 AMBIENT TEMPERATURES................................................................................ 26<br />
2.4 WIND PROFILES................................................................................................ 29<br />
3. 3-D MEASUREMENTS ........................................................................................ 30<br />
3.1 SONIC MEASUREMENT SYSTEM - BASIC STATISTICS ......................................... 30<br />
4. UPDATING RESOURCE ESTIMATES ............................................................ 34<br />
4.1 CHARACTERISING THE LONG-TERM CLIMATE AT HORNS REV.......................... 34<br />
4.2 RESOURCE ESTIMATES USING DIFFERENT METHODOLOGIES ............................. 35<br />
4.2.1 Weibull method ....................................................................................... 35<br />
4.2.2 Measure-correl<strong>at</strong>e-predict (MCP).......................................................... 37<br />
4.3 COMPARISON WITH PREVIOUS ESTIMATES ....................................................... 41<br />
5. STABILITY AND CLIMATE.............................................................................. 42<br />
5.1 SHEAR EXPONENT DISTRIBUTION ..................................................................... 42<br />
5.2 DISTRIBUTION OF GUSTS.................................................................................. 43<br />
6. WIND-WAVE-ROUGHNESS.............................................................................. 45<br />
6.1 MARINE DATA OVERVIEW ................................................................................ 47<br />
6.2 MARINE STATISTICS......................................................................................... 48<br />
6.2.1 Time series plots..................................................................................... 48<br />
6.2.2 Waves...................................................................................................... 50<br />
6.2.3 Currents.................................................................................................. 59<br />
6.3 NUMERICAL SIMULATIONS MODELS ................................................................. 61<br />
6.4 RELATIONSHIP BETWEEN WAVE HEIGHT AND TURBULENCE INTENSITY............ 62<br />
Report no.: D-160949<br />
Tech-wise A/S is an intern<strong>at</strong>ional consulting Tech-wise A/S<br />
engineering company specialised Kraftværksvej 53<br />
in energy and environment DK-7000 Fredericia
energy. environment. knowledge. Page 3 of 69<br />
7. EXTREME EVENTS ............................................................................................ 64<br />
8. UNCERTAINTIES ................................................................................................ 67<br />
9. CONCLUSION ...................................................................................................... 68<br />
10. REFERENCES ...................................................................................................... 69<br />
Report no.: D-160949<br />
Tech-wise A/S is an intern<strong>at</strong>ional consulting Tech-wise A/S<br />
engineering company specialised Kraftværksvej 53<br />
in energy and environment DK-7000 Fredericia
energy. environment. knowledge. Page 4 of 69<br />
1. Site and d<strong>at</strong>a assessment<br />
1.1 Site description<br />
The meteorological mast <strong>at</strong> <strong>Horns</strong> <strong>Rev</strong> is loc<strong>at</strong>ed approxim<strong>at</strong>ely 20 km west of<br />
Blåvands Huk. Its position is 7°47,217'E 55°31,208'N (WGS84) and its UTM<br />
coordin<strong>at</strong>es are 423.412E 6.153.342N (WGS84 Zone 32). The loc<strong>at</strong>ion of the mast is<br />
shown in Figure 1.1. The distances to the nearest shore (fetch distances) are given in<br />
Figure 1.3.<br />
Figure 1.1 Loc<strong>at</strong>ion of met mast <strong>at</strong> <strong>Horns</strong> <strong>Rev</strong>, west of Jutland<br />
1.2 Description of measurements system<br />
A square l<strong>at</strong>tice mast was erected on a monopile close to the projected wind farm site <strong>at</strong><br />
<strong>Horns</strong> <strong>Rev</strong>. In mid-May 1999 the meteorological measurement programme was initi<strong>at</strong>ed<br />
and l<strong>at</strong>er, in June 1999, the marine measurement programme started.<br />
The measuring system comprises a total of five independent systems:<br />
1. Primary meteorological system (10 min).<br />
2. Back-up meteorological system (10 min).<br />
3. Sonic meteorological system (20 Hz).<br />
4. Wave height measuring system.<br />
5. Current and w<strong>at</strong>er level measuring system.<br />
1.2.1 Primary meteorological system<br />
In 1999 the mast <strong>at</strong> <strong>Horns</strong> <strong>Rev</strong> was instrumented with the system shown in Figure 1.2.<br />
The d<strong>at</strong>a acquisition (DAQ) system is capable of collecting and storing st<strong>at</strong>istical values<br />
Report no.: D-160949<br />
Tech-wise A/S is an intern<strong>at</strong>ional consulting Tech-wise A/S<br />
engineering company specialised Kraftværksvej 53<br />
in energy and environment DK-7000 Fredericia
energy. environment. knowledge. Page 5 of 69<br />
from the meteorological instruments. The meteorological measurements introduced in<br />
May 1999 include four-level wind speeds as well as wind directions, temper<strong>at</strong>ures,<br />
<strong>at</strong>mospheric pressure, solar radi<strong>at</strong>ion and lightning detection. The four measurement<br />
levels are 62, 45, 30 and 15 m above DNN (Danish Normal Zero).<br />
<strong>Wind</strong> speed measurements are performed with Risoe Cup Anemometers. They have<br />
been used worldwide during the last 20 years by meteorological institutes, scientific<br />
labor<strong>at</strong>ories, research labor<strong>at</strong>ories, and industry. For the wind direction measurements<br />
ED wind direction sensors are used. This type of wind direction sensor is used<br />
worldwide <strong>at</strong> wind farms, airports, and meteorological st<strong>at</strong>ions. These sensors are<br />
highly suited for saline environments fe<strong>at</strong>uring high wind speeds and wide temper<strong>at</strong>ure<br />
ranges.<br />
St<strong>at</strong>istical values from the primary met system are sent to an onshore d<strong>at</strong>abase once an<br />
hour, and shown on a local web page: http;//212.130.241.250/hornsrev.<br />
Report no.: D-160949<br />
Tech-wise A/S is an intern<strong>at</strong>ional consulting Tech-wise A/S<br />
engineering company specialised Kraftværksvej 53<br />
in energy and environment DK-7000 Fredericia
energy. environment. knowledge. Page 6 of 69<br />
Figure 1.2 Instrument<strong>at</strong>ion primary meteorological system<br />
Report no.: D-160949<br />
Tech-wise A/S is an intern<strong>at</strong>ional consulting Tech-wise A/S<br />
engineering company specialised Kraftværksvej 53<br />
in energy and environment DK-7000 Fredericia
energy. environment. knowledge. Page 7 of 69<br />
To keep the power consumption <strong>at</strong> an absolute minimum, two standard d<strong>at</strong>a loggers<br />
were selected to scan the sensors. The sampling r<strong>at</strong>e is 1Hz, and before being stored in a<br />
flash RAM unit the d<strong>at</strong>a are condensed to 10-min mean values together with maximum,<br />
minimum, and standard devi<strong>at</strong>ions for the averaging period. For the wind speed sensors<br />
a 5-s gust is calcul<strong>at</strong>ed as a mean of five consecutive 1 Hz values. The storage capacity<br />
of the flash RAM unit is equivalent to 9 months of d<strong>at</strong>a.<br />
The main components of the power supply were designed as simply as possible,<br />
comprising a m<strong>at</strong>rix of 2 x 5 x 50 W photovoltaic cells charging 25 NI-Cd b<strong>at</strong>teries with<br />
a capacity of 1070 Ah. The power system is capable of delivering 16 W continuously.<br />
However, due to a miscalcul<strong>at</strong>ion on the part of the erection contractor, the mast is<br />
oriented + 33.1 ° wrong. Because of this mistake the photovoltaic cells devi<strong>at</strong>e 33.1 °<br />
from facing directly south, and are therefore unable to achieve the envisaged power<br />
production. To compens<strong>at</strong>e for th<strong>at</strong> another 4 x 50 W photovoltaic cells were put up to<br />
deliver the needed power capacity.<br />
Figure 1.3 Fetch distances <strong>at</strong> <strong>Horns</strong> <strong>Rev</strong><br />
Direction Fetch (km)<br />
N 280<br />
NNE 62<br />
NE 36<br />
ENE 21<br />
E 25<br />
ESE 44<br />
SE 62<br />
SSE 80<br />
S 190<br />
SSW 240<br />
SW 700<br />
WSW 500<br />
W 600<br />
WNW 600<br />
NW 700<br />
NNW 700<br />
Every spring and autumn the primary met system is subjected to regular maintenance,<br />
and all sensors are replaced with newly calibr<strong>at</strong>ed sensors. Because the project has an<br />
extra set of sensors to replace the existing ones, the system is up and running again in<br />
only a few hours, and only one trip to the offshore mast is needed.<br />
Report no.: D-160949<br />
Tech-wise A/S is an intern<strong>at</strong>ional consulting Tech-wise A/S<br />
engineering company specialised Kraftværksvej 53<br />
in energy and environment DK-7000 Fredericia
energy. environment. knowledge. Page 8 of 69<br />
Figure 1.4 Meteorological mast, pl<strong>at</strong>form and photovoltaic cells<br />
1.2.2 Met back-up system<br />
The met back-up system is instrumented with Aanderaa wind and direction sensors and<br />
with an Aanderaa recorder. Aanderaa recorders are low power systems designed to<br />
Report no.: D-160949<br />
Tech-wise A/S is an intern<strong>at</strong>ional consulting Tech-wise A/S<br />
engineering company specialised Kraftværksvej 53<br />
in energy and environment DK-7000 Fredericia
energy. environment. knowledge. Page 9 of 69<br />
oper<strong>at</strong>e in harsh conditions with a proven track record of reliability. The back-up met<br />
system is a completely separ<strong>at</strong>e d<strong>at</strong>a logger system comprising wind speed, wind<br />
direction and <strong>at</strong>mospheric pressure. The sensors are placed in the top section of the mast<br />
<strong>at</strong> level 58 m ensuring maximum d<strong>at</strong>a coverage in failure situ<strong>at</strong>ions. The sensors are<br />
also used for valid<strong>at</strong>ion of the primary met system measurements. D<strong>at</strong>a from the backup<br />
met system are stored in D<strong>at</strong>a Storage Units (DSU) with a capacity of more than 6<br />
months of measurements.<br />
The back-up met system has a separ<strong>at</strong>ely power supply, an internal b<strong>at</strong>tery th<strong>at</strong> can<br />
supply the sensors and storage units for more than 6 months. The DSU and the b<strong>at</strong>tery<br />
are replaced <strong>at</strong> each maintenance visits.<br />
Report no.: D-160949<br />
Tech-wise A/S is an intern<strong>at</strong>ional consulting Tech-wise A/S<br />
engineering company specialised Kraftværksvej 53<br />
in energy and environment DK-7000 Fredericia
energy. environment. knowledge. Page 10 of 69<br />
Figure 1.5 Instrument<strong>at</strong>ion back-up met system<br />
Report no.: D-160949<br />
Tech-wise A/S is an intern<strong>at</strong>ional consulting Tech-wise A/S<br />
engineering company specialised Kraftværksvej 53<br />
in energy and environment DK-7000 Fredericia
energy. environment. knowledge. Page 11 of 69<br />
1.2.3 Sonic system<br />
In October 1999, a 3D-sonic wind measurement system was installed <strong>at</strong> the<br />
meteorological mast <strong>at</strong> level 50 m above DNN. Time series from the fast response sonic<br />
anemometer are collected and stored on a laptop pc, which is capable of storing time<br />
series (20 Hz d<strong>at</strong>a) from more than 6 months. Two identical laptops were used for d<strong>at</strong>a<br />
storage; one was offshore collecting d<strong>at</strong>a on the meteorological mast, and one was<br />
brought onshore with d<strong>at</strong>a from the last measuring period. The two laptops were<br />
exchanged <strong>at</strong> the maintenance visits.<br />
By November 2001, a new software system for the d<strong>at</strong>a storage laptop had been<br />
developed. Now only one laptop is needed, and the d<strong>at</strong>a are brought onshore on flash<br />
cards <strong>at</strong> each maintenance visit.<br />
St<strong>at</strong>istical 10-min mean values from the sonic system are also autom<strong>at</strong>ically sent to an<br />
onshore d<strong>at</strong>abase by SMS every hour, and can also be accessed on the Internet with a<br />
personal login and password.<br />
Report no.: D-160949<br />
Tech-wise A/S is an intern<strong>at</strong>ional consulting Tech-wise A/S<br />
engineering company specialised Kraftværksvej 53<br />
in energy and environment DK-7000 Fredericia
energy. environment. knowledge. Page 12 of 69<br />
Figure 1.6 Instrument<strong>at</strong>ion sonic system<br />
The sonic system has a separ<strong>at</strong>e power supply system, 4 x 50 W photovoltaic cells, and<br />
an 0.3 A wind turbine th<strong>at</strong> charges 20 b<strong>at</strong>teries with a capacity of 210 Ah. The power<br />
system is capable of delivering 24 W continuously.<br />
Report no.: D-160949<br />
Tech-wise A/S is an intern<strong>at</strong>ional consulting Tech-wise A/S<br />
engineering company specialised Kraftværksvej 53<br />
in energy and environment DK-7000 Fredericia
energy. environment. knowledge. Page 13 of 69<br />
1.3 Quality control<br />
Visual inspection<br />
Once a month, the wind d<strong>at</strong>a are inspected visually, the d<strong>at</strong>a series are plotted with a<br />
d<strong>at</strong>a valid<strong>at</strong>ing tool kit, and quality codes are directly written into the d<strong>at</strong>abase.<br />
D<strong>at</strong>a screening<br />
In addition to the visual inspection of the d<strong>at</strong>a, which is conducted when new d<strong>at</strong>a are<br />
collected, a screening procedure has been developed to identify d<strong>at</strong>a, which could be<br />
faulty. This procedure is used to verify the d<strong>at</strong>a quality of huge amounts of<br />
measurements. Typically these measurements are stored as st<strong>at</strong>istic values (mean (μ),<br />
standard devi<strong>at</strong>ion (σ), maximum and minimum values), where each set of values<br />
represents a period of ten minutes:<br />
The d<strong>at</strong>a screening procedure is performed in 3 steps:<br />
1) Determin<strong>at</strong>ion of spikes<br />
2) Determin<strong>at</strong>ion of drop-outs<br />
3) Determin<strong>at</strong>ion of periods with st<strong>at</strong>ionarity<br />
One reading is defined as one single value (mean, standard devi<strong>at</strong>ion, maximum, or<br />
minimum) representing one 10-min period. All readings are marked with a code = 0<br />
from the start and a spike, a drop-out, or st<strong>at</strong>ionarity indic<strong>at</strong>ion, which gives a new code<br />
value according to the code numbers listed below.<br />
1.3.1 Determin<strong>at</strong>ion of spikes<br />
Table 1.1 Definition of quality codes<br />
Code Item<br />
0 The reading is not valid<strong>at</strong>ed<br />
1 The reading is valid<strong>at</strong>ed<br />
2 The reading contains a spike<br />
3 The reading contains a drop-out<br />
4 -<br />
5 -<br />
9 The reading is faulty<br />
A spike is defined as an abnormal devi<strong>at</strong>ion from the recorded mean value. For this<br />
procedure four st<strong>at</strong>istical values (mean, standard devi<strong>at</strong>ion, minimum and maximum)<br />
are used.<br />
A spike occurs if:<br />
(1) |maximum-μ| > 4 × σ or<br />
(2) |μ-minimum| > 4 × σ<br />
Report no.: D-160949<br />
Tech-wise A/S is an intern<strong>at</strong>ional consulting Tech-wise A/S<br />
engineering company specialised Kraftværksvej 53<br />
in energy and environment DK-7000 Fredericia
energy. environment. knowledge. Page 14 of 69<br />
All spikes (>4×σ) are identified by means of a screening procedure and inspected<br />
afterwards, but only significant spikes are marked with a code = 2. The second<br />
condition (2) could result in code = 3, which indic<strong>at</strong>es a signal drop to zero.<br />
This procedure is only applicable for wind speed signals, while it is based on both<br />
maximum and minimum values.<br />
1.3.2 Determin<strong>at</strong>ion of signal drop-outs<br />
1) The wind speed signal drop-out is determined as a period with low (= zero signal)<br />
values corresponding to the minimum signal reading (< 0.1 m/s).<br />
2) Furthermore, periods with low signal activity (σ
energy. environment. knowledge. Page 15 of 69<br />
1.4 D<strong>at</strong>a overview<br />
The d<strong>at</strong>a coverage r<strong>at</strong>e for the measurement systems is shown in the table below.<br />
Table 1.3 D<strong>at</strong>a coverage r<strong>at</strong>e for the meteorological measurement systems.<br />
Measuring system D<strong>at</strong>a period Hours D<strong>at</strong>a coverage<br />
Primary met. system<br />
Back-up met system<br />
Sonic System<br />
May 1999–Nov. 2002<br />
May 1999–Nov 2002<br />
October 1999–Nov. 2002<br />
1.4.1 Directional sensitivity analysis<br />
30638<br />
30359<br />
26888<br />
99.05%<br />
87.99%<br />
37.35%<br />
The directional sensitivity has been investig<strong>at</strong>ed for wind vanes mounted <strong>at</strong> three<br />
different heights (28, 43 and 60 m above DNN) and is based on more than 21,000 hours<br />
of measurements recorded in the wind speed range (5–25) m/s.<br />
The reference height is 60 m and the bin-averaged differences (bin size =2°) are shown<br />
on Figure 1.7-a. The maximum absolute difference is measured in the northern direction<br />
and decreases towards the south. All three vanes are free of wake effects in the VSV<br />
sector (258 ±90°), although they do not agree very well (+2/-3°) even in this sector. The<br />
best agreement has been obtained for 180° ±35°.<br />
This analysis recommends th<strong>at</strong> the wind direction measured <strong>at</strong> height 60 m be used, and<br />
not to merge directional measurements from the other levels. The uncertainty of the<br />
absolute directional measurement is ±4°. Figure 1.7-b shows th<strong>at</strong> the mast wake<br />
domin<strong>at</strong>es the measurements in direction 20–45°, corresponding to a boom direction of<br />
212°. The average standard devi<strong>at</strong>ion of the wind direction measurement is approx. 4° -<br />
in free, undisturbed winds.<br />
Report no.: D-160949<br />
Tech-wise A/S is an intern<strong>at</strong>ional consulting Tech-wise A/S<br />
engineering company specialised Kraftværksvej 53<br />
in energy and environment DK-7000 Fredericia
energy. environment. knowledge. Page 16 of 69<br />
Figure 1.7 Directional behaviour measured <strong>at</strong> <strong>Horns</strong> <strong>Rev</strong>, level 28, 43 and 60 m.<br />
Mast effects<br />
The mast speed-up and mast wake effect <strong>at</strong> three different levels (15, 30 and 45 m) have<br />
been investig<strong>at</strong>ed for wind speeds between 5 and 25 m/s with reference to the wind<br />
speed direction measured 60 m above sea DNN. Each level is represented with<br />
measurements recorded in the SV and NE directions and the cup anemometer loc<strong>at</strong>ions<br />
<strong>at</strong> each level are listed in Table 1.4.<br />
The mast effect is determined as the r<strong>at</strong>io SV/NE, which is bin-averaged against the<br />
wind direction and shown in Figure 1.9-a. This figure shows a very distinct wake effect<br />
<strong>at</strong> all three levels, and it is recommended to use the free, undisturbed wind signal for<br />
further analysis. The recommended sectors with free, undisturbed wind speeds are listed<br />
in Table 1.5.<br />
It should be noted th<strong>at</strong> the large devi<strong>at</strong>ions in Figure 1.9-a mainly reflects the deficits<br />
measured in the wake of the mast. The difference in the r<strong>at</strong>io from level to level, mainly<br />
reflects the difference in the mast solidity and boom length.<br />
Report no.: D-160949<br />
Tech-wise A/S is an intern<strong>at</strong>ional consulting Tech-wise A/S<br />
engineering company specialised Kraftværksvej 53<br />
in energy and environment DK-7000 Fredericia
energy. environment. knowledge. Page 17 of 69<br />
Table 1.4 Mast and boom dimensions<br />
Level Dimensions Diagonal Boom length<br />
62 m - cup Top mounted Top mounted Top mounted<br />
60 m - vane ? 1.15 1.63 m 4.20 m<br />
45 m - cup ? 1.26 1.78 m 4.35 m<br />
43 m - vane ? 1.29 1.82 m 4.40 m<br />
30 m – cup ? 1.42 2.01 m 4.75 m<br />
28 m – vane ? 1.46 2.06 m 4.80 m<br />
15 m – cup ? 1.81 2.56 m 5.40 m<br />
Table 1.5 Recommended free sectors<br />
Level Sector Channel/signal<br />
62 0–360° CUP62M<br />
45 168–348° CUP45SV<br />
45 0–168° & 348–360° CUP45NO<br />
30 168–348° CUP30SV<br />
30 0–168° & 348–360° CUP30NO<br />
15 168–348° CUP15SV<br />
15 0–168° & 348–360° CUP15NO<br />
Figure 1.8 Boom orient<strong>at</strong>ion <strong>at</strong> the meteorological mast<br />
Report no.: D-160949<br />
Tech-wise A/S is an intern<strong>at</strong>ional consulting Tech-wise A/S<br />
engineering company specialised Kraftværksvej 53<br />
in energy and environment DK-7000 Fredericia
energy. environment. knowledge. Page 18 of 69<br />
Figure 1.9 wake effects measured <strong>at</strong> 3 levels on the <strong>Horns</strong> <strong>Rev</strong> mast<br />
1.4.2 Primary met system<br />
Despite the poor accessibility to the measuring site, the practical problems encountered<br />
during the first three years of oper<strong>at</strong>ion of the original meteorological systems have<br />
been few, and mainly restricted to damage due to lightning and mechanical damage<br />
caused by an extreme hurricane over Denmark on December 3, 1999.<br />
The top anemometer <strong>at</strong> level 62 m was struck by lightning in October 1999, and the<br />
sensor had to be replaced. Disassembly of the anemometer revealed severe damage to<br />
the rotor cup and to the bearing system caused by the induced overhe<strong>at</strong>ing. The mast<br />
was equipped with lightning detectors, but unfortun<strong>at</strong>ely no lightning was detected<br />
during the measurement period. A technical investig<strong>at</strong>ion of the damaged anemometer<br />
demonstr<strong>at</strong>ed th<strong>at</strong> the lightning induced current was bene<strong>at</strong>h the detection range (~ 1000<br />
A) of the sensors, which explains why no lightning was recorded for October 1999.<br />
During the storm on December 3, 1999, parts of the electrical system were pushed out<br />
of their sockets as large waves impinged on the walls of the measurement shed loc<strong>at</strong>ed<br />
<strong>at</strong> level 6.2. This disconnected the power supply to the primary measuring system and<br />
hence caused a total system shut-down. Fortun<strong>at</strong>ely, the redundant measuring system<br />
Report no.: D-160949<br />
Tech-wise A/S is an intern<strong>at</strong>ional consulting Tech-wise A/S<br />
engineering company specialised Kraftværksvej 53<br />
in energy and environment DK-7000 Fredericia
energy. environment. knowledge. Page 19 of 69<br />
continued to record d<strong>at</strong>a ensuring full d<strong>at</strong>a coverage from the top section of the mast<br />
during the following 10 days of “power out”.<br />
When evalu<strong>at</strong>ing the outcome of the analysis, the following facts should be kept in<br />
mind:<br />
• The wind speed d<strong>at</strong>a have not been corrected due to over-speeding caused by<br />
boom distortion. The rotors of the cup anemometers have been raised more than<br />
55 cm above the mounting booms and the expected over-speeding amounts to less<br />
than 1% according to [1].<br />
• To reduce the considerable effect of flow distortion (mentioned in [2]) from the<br />
l<strong>at</strong>tice mast, wind speed sensors placed <strong>at</strong> opposite sides of the mast are used<br />
when evalu<strong>at</strong>ing the st<strong>at</strong>istical values for the lower levels of the mast (45, 30 and<br />
15 m). For these levels, wind speed d<strong>at</strong>a are selected from the up-wind side of the<br />
mast.<br />
It should be noted th<strong>at</strong> the actual measuring levels are influenced by the changing sea<br />
levels due to the changing tides and sea swells <strong>at</strong> the <strong>Horns</strong> <strong>Rev</strong> site. In the analysis<br />
below there have been no <strong>at</strong>tempts <strong>at</strong> neutralising the influence from the changing sea<br />
levels. The sea levels changes from 1.31 m below DNN (Danish Normal Zero) to 2.80<br />
m above DNN can be seen from Table 6.2.<br />
Figure 1.10 Example of d<strong>at</strong>a from wind speed sensor <strong>at</strong> level 62 m, primary met system<br />
10 min. mean values<br />
1.4.3 Back-up met system<br />
On the whole, the Back-up met system shows low d<strong>at</strong>a coverage; however, it should be<br />
noted th<strong>at</strong> for a considerable period of time (April to September 2000) the sensor<br />
b<strong>at</strong>tery was low due to insufficient maintenance.<br />
Report no.: D-160949<br />
Tech-wise A/S is an intern<strong>at</strong>ional consulting Tech-wise A/S<br />
engineering company specialised Kraftværksvej 53<br />
in energy and environment DK-7000 Fredericia
energy. environment. knowledge. Page 20 of 69<br />
Figure 1.11 Example of d<strong>at</strong>a from wind speed sensor <strong>at</strong> level 58 m, Back-up met system<br />
10-min. mean values<br />
1.4.4 Sonic system<br />
The sonic system shows very low d<strong>at</strong>a coverage because of problems with the sensors,<br />
d<strong>at</strong>a transmission from the sensor to the storage unit, low power capacity from the<br />
b<strong>at</strong>teries, d<strong>at</strong>a storage on a lap top, and - of course - the access to the met mast. The<br />
maintenance visits to the met mast are very expensive, and therefore failures of the<br />
sonic system are not been repaired until next scheduled maintenance visit, or until<br />
several systems need maintenance.<br />
2. St<strong>at</strong>istics<br />
To give an overview of the wind records compiled from May 1999 to November 2002<br />
<strong>at</strong> <strong>Horns</strong> <strong>Rev</strong>, this section evalu<strong>at</strong>es the main characteristics of the d<strong>at</strong>a.<br />
2.1 <strong>Wind</strong> speed and turbulence<br />
Main st<strong>at</strong>istical values for the measuring period:<br />
Table 2.1. Main st<strong>at</strong>istical 10-min mean values d<strong>at</strong>a, May 1999 to November 2002<br />
Height 62 45 30 15<br />
Mean <strong>Wind</strong> Speed [m/s]<br />
Max. <strong>Wind</strong> Speed [m/s]<br />
Mean <strong>Wind</strong> Direction [º]<br />
Mean Turbulence Intensity [-]<br />
Weibull Scale Parameter [m/s]<br />
Weibull Shape Parameter [-]<br />
<strong>Wind</strong> Shear (to nearest)<br />
9.46<br />
45.4<br />
254<br />
0.079<br />
10.59<br />
2.3<br />
0.16<br />
8.85<br />
43.1<br />
254<br />
0.09<br />
10.05<br />
2.3<br />
0.10<br />
8.51<br />
40.7<br />
254<br />
0.092<br />
9.64<br />
2.3<br />
0.10<br />
7.89<br />
39.5<br />
-<br />
0.107<br />
8.98<br />
2.2<br />
-<br />
Report no.: D-160949<br />
Tech-wise A/S is an intern<strong>at</strong>ional consulting Tech-wise A/S<br />
engineering company specialised Kraftværksvej 53<br />
in energy and environment DK-7000 Fredericia
energy. environment. knowledge. Page 21 of 69<br />
The wind speed distribution <strong>at</strong> 62 m shown in Figure 2.1 is evalu<strong>at</strong>ed as the rel<strong>at</strong>ive<br />
number of observ<strong>at</strong>ions by 1 m/s wind speed bins for all direction sectors <strong>at</strong> 62 m<br />
height.<br />
Observ<strong>at</strong>ions [%]<br />
Figure 2.1 Frequency distribution of wind speeds level 62 m from measurements, April<br />
1999 to November 2002<br />
<strong>Wind</strong>speed [m/s]<br />
10%<br />
9%<br />
8%<br />
7%<br />
6%<br />
5%<br />
4%<br />
3%<br />
2%<br />
1%<br />
0%<br />
14<br />
12<br />
10<br />
8<br />
6<br />
4<br />
2<br />
0<br />
1 2 3 4 5 6 7 8 9 10 11 12 13 14 15 16 17 18 19 20 21 22 23 24 25 26 27 28 29 30<br />
<strong>Wind</strong> Speed [m/s]<br />
1 2 3 4 5 6 7 8 9 10 11 12<br />
Month<br />
Figure 2.2 Monthly vari<strong>at</strong>ion of average wind speed, May 1999 to November 2002<br />
W<br />
S<br />
E<br />
N<br />
Level62<br />
Level45<br />
Level30<br />
Level15<br />
Report no.: D-160949<br />
Tech-wise A/S is an intern<strong>at</strong>ional consulting Tech-wise A/S<br />
engineering company specialised Kraftværksvej 53<br />
in energy and environment DK-7000 Fredericia
energy. environment. knowledge. Page 22 of 69<br />
<strong>Wind</strong>speed [m/s]<br />
Figure 2.3 Seasonal vari<strong>at</strong>ion of wind speed day-to-day <strong>at</strong> level 62 m, May 1999 to<br />
November 2002<br />
Since the hour-by-hour vari<strong>at</strong>ions in Figure 2.4 are based on d<strong>at</strong>a from 2000 and 2001<br />
only, no seasonal vari<strong>at</strong>ions of the d<strong>at</strong>a coverage influence the result.<br />
<strong>Wind</strong>speed [m/s]<br />
14<br />
12<br />
10<br />
8<br />
6<br />
4<br />
2<br />
0<br />
10.2<br />
10<br />
9.8<br />
9.6<br />
9.4<br />
9.2<br />
9<br />
1 2 3 4 5 6 7 8 9 10 11 12<br />
Month<br />
8.8<br />
0 4 8 12 16 20 24<br />
Hour<br />
Level62<br />
Level45<br />
Level30<br />
Level15<br />
Figure 2.4 Diurnal vari<strong>at</strong>ions of wind speed hour-by-hour <strong>at</strong> level 62 m, 2000 and 2001<br />
only<br />
2000<br />
2001<br />
Report no.: D-160949<br />
Tech-wise A/S is an intern<strong>at</strong>ional consulting Tech-wise A/S<br />
engineering company specialised Kraftværksvej 53<br />
in energy and environment DK-7000 Fredericia
energy. environment. knowledge. Page 23 of 69<br />
Turbulence Intensity [%]<br />
20%<br />
18%<br />
16%<br />
14%<br />
12%<br />
10%<br />
8%<br />
6%<br />
4%<br />
2%<br />
0%<br />
0 2 4 6 8 10 12 14 16 18 20 22 24 26<br />
<strong>Wind</strong> Speed [m/s]<br />
Figure 2.5 Vari<strong>at</strong>ion of mean turbulence intensity with wind speed <strong>at</strong> level 62 m, May<br />
1999 to November 2002<br />
The mean turbulence intensity <strong>at</strong> level 62 m is 0.079. Figure 2.5 shows the distribution<br />
of turbulence intensity versus wind speed. The turbulence intensity is high <strong>at</strong> low wind<br />
speeds, decreases to a minimum between 8 and 12 m/s, and increases again with<br />
increasing wind speed, probably due to increasing wave height.<br />
270<br />
300<br />
240<br />
330<br />
210<br />
11%<br />
10%<br />
9%<br />
8%<br />
7%<br />
6%<br />
0<br />
180<br />
Figure 2.6 Mean turbulence intensity <strong>at</strong> each measurement level and each sector, May<br />
1999 to November 2002<br />
30<br />
150<br />
60<br />
120<br />
90<br />
kote15<br />
kote30<br />
kote45<br />
kote62<br />
Report no.: D-160949<br />
Tech-wise A/S is an intern<strong>at</strong>ional consulting Tech-wise A/S<br />
engineering company specialised Kraftværksvej 53<br />
in energy and environment DK-7000 Fredericia
energy. environment. knowledge. Page 24 of 69<br />
PDF<br />
Figure 2.7 Frequency distribution of wind speed and the Weibull fit with different k<br />
parameters, May 1999 to November 2002.<br />
Exceedence probability<br />
10%<br />
9%<br />
8%<br />
7%<br />
6%<br />
5%<br />
4%<br />
3%<br />
2%<br />
1%<br />
0%<br />
100%<br />
90%<br />
80%<br />
70%<br />
60%<br />
50%<br />
40%<br />
30%<br />
20%<br />
10%<br />
0%<br />
0 1 2 3 4 5 6 7 8 9 10 11 12 13 14 15 16 17 18 19 20 21 22 23 24 25<br />
<strong>Wind</strong> speed level +62 (m/s)<br />
Measured<br />
Figure 2.8 Exceedence of probability of 10-min wind speed <strong>at</strong> level 62 m, May 1999 to<br />
November 2002<br />
k=2.2<br />
k=2.3<br />
k=2.4<br />
k=2.0<br />
0 5 10 15 20 25<br />
10 min. <strong>Wind</strong> speed, level +62 (m/s)<br />
Report no.: D-160949<br />
Tech-wise A/S is an intern<strong>at</strong>ional consulting Tech-wise A/S<br />
engineering company specialised Kraftværksvej 53<br />
in energy and environment DK-7000 Fredericia
energy. environment. knowledge. Page 25 of 69<br />
2.2 <strong>Wind</strong> direction<br />
As expected, the winds are mainly south-westerly. The directional distribution is found<br />
as the rel<strong>at</strong>ive number of observ<strong>at</strong>ions by direction sectors of 30°.<br />
W<br />
14%<br />
12%<br />
10%<br />
8%<br />
6%<br />
4%<br />
2%<br />
0%<br />
N<br />
S<br />
Figure 2.9 <strong>Wind</strong> rose showing frequency directional distribution level 60 m. Distance<br />
from origin is the frequency of samples. May 1999 to November 2002<br />
E<br />
Report no.: D-160949<br />
Tech-wise A/S is an intern<strong>at</strong>ional consulting Tech-wise A/S<br />
engineering company specialised Kraftværksvej 53<br />
in energy and environment DK-7000 Fredericia
energy. environment. knowledge. Page 26 of 69<br />
Figure 2.10 Mean wind speed distribution. Distance from origin is the mean wind speed<br />
in m/s. May 1999 to November 2002<br />
2.3 Ambient temper<strong>at</strong>ures<br />
Frequency [pct]<br />
9<br />
8<br />
7<br />
6<br />
5<br />
4<br />
3<br />
2<br />
1<br />
0<br />
-10<br />
-8<br />
-6<br />
-4<br />
W<br />
-2<br />
0<br />
2<br />
4<br />
N<br />
12<br />
Figure 2.11 Temper<strong>at</strong>ure distribution <strong>at</strong> level 55 m for 2001 only<br />
6<br />
11<br />
10<br />
9<br />
8<br />
7<br />
6<br />
8<br />
S<br />
10<br />
12<br />
14<br />
Degree centigrade<br />
16<br />
18<br />
20<br />
E<br />
22<br />
24<br />
26<br />
28<br />
30<br />
Report no.: D-160949<br />
Tech-wise A/S is an intern<strong>at</strong>ional consulting Tech-wise A/S<br />
engineering company specialised Kraftværksvej 53<br />
in energy and environment DK-7000 Fredericia
energy. environment. knowledge. Page 27 of 69<br />
Degrees centigrade<br />
Figure 2.12 Daily mean temper<strong>at</strong>ure <strong>at</strong> level 55 m, May 1999 to November2002<br />
Degrees centigrade<br />
18<br />
16<br />
14<br />
12<br />
10<br />
25<br />
20<br />
15<br />
10<br />
8<br />
6<br />
4<br />
2<br />
0<br />
5<br />
0<br />
0 25 50 75 100 125 150 175 200 225 250 275 300 325 350<br />
Day number<br />
1 2 3 4 5 6 7 8 9 10 11 12<br />
Month<br />
Figure 2.13 Monthly mean temper<strong>at</strong>ure <strong>at</strong> level 55 m, May 1999 to November2002<br />
Report no.: D-160949<br />
Tech-wise A/S is an intern<strong>at</strong>ional consulting Tech-wise A/S<br />
engineering company specialised Kraftværksvej 53<br />
in energy and environment DK-7000 Fredericia
energy. environment. knowledge. Page 28 of 69<br />
Degree centigrade<br />
9.6<br />
9.5<br />
9.4<br />
9.3<br />
9.2<br />
9.1<br />
9<br />
8.9<br />
8.8<br />
0 4 8 12 16 20 24<br />
Hour<br />
Figure 2.14 Daily vari<strong>at</strong>ion of mean temper<strong>at</strong>ure <strong>at</strong> level 55 m, 2000 and 2001 only<br />
Report no.: D-160949<br />
Tech-wise A/S is an intern<strong>at</strong>ional consulting Tech-wise A/S<br />
engineering company specialised Kraftværksvej 53<br />
in energy and environment DK-7000 Fredericia
energy. environment. knowledge. Page 29 of 69<br />
2.4 <strong>Wind</strong> profiles<br />
Level above DNN [m]<br />
70<br />
60<br />
50<br />
40<br />
30<br />
20<br />
10<br />
0<br />
Measured<br />
Z0=0.0002<br />
Z0=0.002<br />
Z0=0.01<br />
0.0 2.0 4.0 6.0 8.0 10.0<br />
<strong>Wind</strong> Speed [m/s]<br />
Figure 2.15 Average wind speed profile all sectors. D<strong>at</strong>a from May 1999 to November<br />
2002.<br />
<strong>Wind</strong> speed profiles offshore are expected to conform to logarithmic profiles, but when<br />
looking <strong>at</strong> the observed average wind speeds <strong>at</strong> the four levels in Figure 2.16, the<br />
figures reveal th<strong>at</strong> the wind speeds <strong>at</strong> 62 m are somewh<strong>at</strong> higher than could be expected<br />
from a logarithmic prediction.<br />
Report no.: D-160949<br />
Tech-wise A/S is an intern<strong>at</strong>ional consulting Tech-wise A/S<br />
engineering company specialised Kraftværksvej 53<br />
in energy and environment DK-7000 Fredericia
energy. environment. knowledge. Page 30 of 69<br />
Level above DNN [m]<br />
(Lognormal scale)<br />
100<br />
10<br />
Figure 2.16 Semi-logarithmic plot of observed wind speeds by height. <strong>Wind</strong> speeds are<br />
averaged for all sectors. May 1999 to November 2002<br />
[8] discusses different factors th<strong>at</strong> will lead to distortion of the profile away from<br />
logarithmic predictions, and it is worth noting th<strong>at</strong> [8] has found the same tendency for<br />
other offshore sites in Denmark. At the moment, no further analyses have been initi<strong>at</strong>ed<br />
to clarify this subject here.<br />
3. 3-D measurements<br />
3.1 Sonic measurement system - basic st<strong>at</strong>istics<br />
All the 3-D sonic time series are measured 50 m above sea level, and are stored in a<br />
common file form<strong>at</strong> in the D<strong>at</strong>abase of <strong>Wind</strong> Characteristics 1 [3] where Table 3.1<br />
summarises the annual recordings. The d<strong>at</strong>a quality of the sonic measurements has been<br />
improved during the measurement period, and time series recorded after September<br />
2001 include a sonic temper<strong>at</strong>ure and a limited number of spikes (approx. 4000 hours).<br />
This section contains a number of plots based on st<strong>at</strong>istical values extracted from [3].<br />
1 D<strong>at</strong>abase on <strong>Wind</strong> Characteristics (http://www.windd<strong>at</strong>a.com/)<br />
Measured<br />
7.0 7.5 8.0 8.5 9.0 9.5 10.0<br />
<strong>Wind</strong> Speed [m/s]<br />
Report no.: D-160949<br />
Tech-wise A/S is an intern<strong>at</strong>ional consulting Tech-wise A/S<br />
engineering company specialised Kraftværksvej 53<br />
in energy and environment DK-7000 Fredericia
energy. environment. knowledge. Page 31 of 69<br />
Table 3.1 Summary of sonic time series, measured <strong>at</strong> <strong>Horns</strong> <strong>Rev</strong><br />
Year Hours Days Size<br />
1999 310 15 397 MB<br />
2000 773 36 991 MB<br />
2001 5634 242 5.62 GB<br />
2002 2184 93 1.25 GB<br />
Total 8902 386 8.26 GB<br />
The estim<strong>at</strong>ed Weibull distribution based on the sonic u–component measurements is<br />
(A=10.6 m/s, k=2.42, U= 9.36 m/s), and Figure 3.1 shows th<strong>at</strong> the wind speed range 5–<br />
25 m/s is represented very well. The component turbulence intensity including standard<br />
devi<strong>at</strong>ion is shown as a function of sonic speed on Figure 3.1, and the average<br />
turbulence is listed in Table 3.2. The turbulence intensity increases as expected for an<br />
offshore site, due to increased wave height.<br />
Figure 3.1 3-D turbulence <strong>at</strong> <strong>Horns</strong> <strong>Rev</strong>, h=50 m asl<br />
Table 3.2 Average 3-D turbulence <strong>at</strong> <strong>Horns</strong> <strong>Rev</strong>, h=50m asl<br />
Turbulence V=10 m/s V=15 m/s V=20 m/s V=25 m/s<br />
TIu 6.3% 6.8% 8.2% 8.6%<br />
TIv 5.4% 5.5% 6.3% 7.0%<br />
TIw 3.4% 3.6% 4.2% 4.7%<br />
Report no.: D-160949<br />
Tech-wise A/S is an intern<strong>at</strong>ional consulting Tech-wise A/S<br />
engineering company specialised Kraftværksvej 53<br />
in energy and environment DK-7000 Fredericia
energy. environment. knowledge. Page 32 of 69<br />
The average sonic tilt angle (devi<strong>at</strong>ion from horizontal plane) is shown on Figure 3.2<br />
together with the frictional velocity (u*) as a function of the sonic speed. The increase<br />
in the frictional velocity u* reflects the increased roughness length.<br />
Figure 3.2 Flow angle (tilt) and frictional velocity u* measured <strong>at</strong> <strong>Horns</strong> <strong>Rev</strong>, h=50 m<br />
The 3’ order (skewness) and 4’ order (kurtosis) moments for each sonic component are<br />
shown as a function of the sonic speed in Figure 3.3, Figure 3.4 and Figure 3.5. The 3’<br />
moment and the m<strong>at</strong>ching standard devi<strong>at</strong>ion reflect the gustiness of the wind 2 , where<br />
neg<strong>at</strong>ive skewness indic<strong>at</strong>es neg<strong>at</strong>ive gusts (lulls).<br />
Figure 3.3 3’ and 4’ order moments of the sonic u-component measured <strong>at</strong> <strong>Horns</strong> <strong>Rev</strong>,<br />
h=50 m asl<br />
2 The Gaussian distribution is characterized by skewness equal to 0 and kurtosis equal to 3.<br />
Report no.: D-160949<br />
Tech-wise A/S is an intern<strong>at</strong>ional consulting Tech-wise A/S<br />
engineering company specialised Kraftværksvej 53<br />
in energy and environment DK-7000 Fredericia
energy. environment. knowledge. Page 33 of 69<br />
Figure 3.4 3’ and 4’ order moments of the sonic v-component measured <strong>at</strong> <strong>Horns</strong> <strong>Rev</strong>,<br />
h=50 m asl<br />
Figure 3.5 3’ and 4’ order moments of the sonic w-component measured <strong>at</strong> <strong>Horns</strong> <strong>Rev</strong>,<br />
h=50 m asl<br />
An example of measured 3-D time series including sonic temper<strong>at</strong>ure is shown in<br />
Figure 3.6. This time series contains a (large) gust of approx. 10 m/s and with a<br />
skewness of 2.8; a gust of this n<strong>at</strong>ure is however not severe to any wind turbines,<br />
because the gust rise time is r<strong>at</strong>her long (>40 s).<br />
Report no.: D-160949<br />
Tech-wise A/S is an intern<strong>at</strong>ional consulting Tech-wise A/S<br />
engineering company specialised Kraftværksvej 53<br />
in energy and environment DK-7000 Fredericia
energy. environment. knowledge. Page 34 of 69<br />
Figure 3.6 example of measured 3-D time series<br />
4. Upd<strong>at</strong>ing resource estim<strong>at</strong>es<br />
It is well-known th<strong>at</strong> short-term measurements do not capture the full-range of<br />
variability of wind speeds <strong>at</strong> a site. The aim of this section is to use different methods to<br />
assess the wind resource <strong>at</strong> the offshore measurement site based on long-term<br />
(clim<strong>at</strong>ological) d<strong>at</strong>a sets. The purpose of using different methods is th<strong>at</strong> each<br />
methodology has different strengths and weaknesses and by comparing the results the<br />
uncertainty of the analysis can be estim<strong>at</strong>ed.<br />
4.1 Characterising the long-term clim<strong>at</strong>e <strong>at</strong> <strong>Horns</strong> <strong>Rev</strong><br />
D<strong>at</strong>a from the offshore meteorological mast <strong>at</strong> <strong>Horns</strong> <strong>Rev</strong> are compared with those from<br />
the land-based meteorological st<strong>at</strong>ion <strong>at</strong> Hvide Sande. Since d<strong>at</strong>a are available from<br />
Hvide Sande covering the period 1989 to 2002, the measurements <strong>at</strong> the site capture the<br />
long-term variability of wind speeds in western Denmark. By establishing a rel<strong>at</strong>ionship<br />
between the d<strong>at</strong>a <strong>at</strong> the offshore site and the land-based Hvide Sande site for the period<br />
Report no.: D-160949<br />
Tech-wise A/S is an intern<strong>at</strong>ional consulting Tech-wise A/S<br />
engineering company specialised Kraftværksvej 53<br />
in energy and environment DK-7000 Fredericia
energy. environment. knowledge. Page 35 of 69<br />
of simultaneous measurements (May 1999 to October 2002), d<strong>at</strong>a from the offshore site<br />
can be corrected to allow for the fact th<strong>at</strong> the clim<strong>at</strong>e during the period of measurement<br />
may differ from the clim<strong>at</strong>e from a long-term perspective.<br />
An approxim<strong>at</strong>e value for the mean wind speed <strong>at</strong> <strong>Horns</strong> <strong>Rev</strong> can be obtained using a<br />
straightforward comparison of the two periods. The mean long-term wind speed <strong>at</strong> a<br />
height of 27.5 m <strong>at</strong> Hvide Sande is 7.14 m/s, but with 6.91 m/s 3.2% lower during the<br />
overlap period. It is therefore to be expected th<strong>at</strong> the mean wind speeds <strong>at</strong> <strong>Horns</strong> <strong>Rev</strong><br />
are approxim<strong>at</strong>ely 3.2% higher than the 9.49 m/s measured during the overlap period,<br />
i.e. approx. 9.79 m/s.<br />
In the following sections, the methodologies used in the previous analysis are employed<br />
to upd<strong>at</strong>e the wind resource estim<strong>at</strong>es for <strong>Horns</strong> <strong>Rev</strong>. These results are then compared<br />
with those conducted in previous correl<strong>at</strong>ion analyses performed by Tech-wise and<br />
Risoe.<br />
It should be noted th<strong>at</strong> mast shadow corrections have not been used to correct neither<br />
the <strong>Horns</strong> <strong>Rev</strong> d<strong>at</strong>a nor the long-term d<strong>at</strong>a set from Hvide Sande for the following<br />
reasons:<br />
1. To retain comparability with previous analyses.<br />
2. All wind resource estim<strong>at</strong>es are performed based on the wind speeds from the<br />
top anemometer, which is expected to exhibit the least mast shadow effects in<br />
the record.<br />
3. Because it is not possible to correct d<strong>at</strong>a from Hvide Sande.<br />
4.2 Resource estim<strong>at</strong>es using different methodologies<br />
Different methodologies are employed to reduce the uncertainties of the predicted wind<br />
speeds. However, the Weibull correction and measure-correl<strong>at</strong>e-predict (MCP) methods<br />
do not account for the differences in directional distribution between predictor and<br />
predictand sites.<br />
4.2.1 Weibull method<br />
The Weibull correction method for extrapol<strong>at</strong>ing wind speed d<strong>at</strong>a series is based on the<br />
concept of modifying the Weibull parameters to characterise a longer d<strong>at</strong>a sampling<br />
period (as described in section 4.1). The method was developed and described in[4], but<br />
in brief is employed as follows:<br />
Report no.: D-160949<br />
Tech-wise A/S is an intern<strong>at</strong>ional consulting Tech-wise A/S<br />
engineering company specialised Kraftværksvej 53<br />
in energy and environment DK-7000 Fredericia
energy. environment. knowledge. Page 36 of 69<br />
1. A d<strong>at</strong>a period is chosen where wind speeds from both 62 m <strong>Horns</strong> <strong>Rev</strong> and 27.5<br />
m <strong>at</strong> Hvide Sande mast are available. The 27.5 m level from Hvide Sande is<br />
chosen as a long time series represent<strong>at</strong>ive of the ”average” wind clim<strong>at</strong>e.<br />
2. Weibull shape (A) and scale (k) factors are determined for each of the 12 wind<br />
sectors for both sites and the differences between the two sites are calcul<strong>at</strong>ed as<br />
a correction factor for both A and k.<br />
3. The correction factors calcul<strong>at</strong>ed for the shape and scale parameters between<br />
<strong>Horns</strong> <strong>Rev</strong> and Hvide Sande are applied to the Weibull factors calcul<strong>at</strong>ed for the<br />
long d<strong>at</strong>a set <strong>at</strong> Hvide Sande.<br />
There are two vari<strong>at</strong>ions of this method - direct correction of A and k parameters [4], or<br />
using the first and third moments to conserve the total energy of the sector-wise<br />
distributions [5]. The first method is used here.<br />
Table 4.1 Weibull shape and scale factors <strong>at</strong> Hvide Sande (27.5 m) and <strong>Horns</strong> <strong>Rev</strong> (62<br />
m), May 1999 to October 2002<br />
Hvide Sande <strong>Horns</strong> <strong>Rev</strong><br />
Correction<br />
factors<br />
Sector A k % A k % A k<br />
mean 7.81 2.23 100.0 10.71 2.33 100.0 1.37 1.04<br />
N 5.46 1.95 4.3 8.65 2.11 5.1 1.59 1.08<br />
NNE 6.20 1.93 4.4 8.86 2.05 4.3 1.43 1.07<br />
ENE 6.63 2.40 4.4 8.15 2.35 4.4 1.23 0.98<br />
E 8.44 2.99 7.9 9.98 2.55 6.6 1.18 0.85<br />
ESE 8.48 2.72 9.4 11.35 2.81 8.9 1.34 1.03<br />
SSE 7.15 2.37 7.3 10.96 2.74 6.5 1.53 1.16<br />
S 7.56 2.42 7.9 11.28 2.63 8.7 1.49 1.08<br />
SSW 8.10 2.39 10.4 11.50 2.40 11.5 1.42 1.01<br />
WSW 8.08 2.23 11.5 11.08 2.23 12.1 1.37 1.00<br />
W 8.15 2.14 12.0 10.94 2.28 11.1 1.34 1.06<br />
WNW 8.61 2.07 13.5 11.27 2.29 11.4 1.31 1.11<br />
NNW 7.15 2.30 7.3 10.55 2.28 9.6 1.48 0.99<br />
Mean <strong>Wind</strong> Speed Hvide Sande 6.9 m/s<br />
Mean <strong>Wind</strong> Speed <strong>Horns</strong> <strong>Rev</strong> 9.5 m/s<br />
Report no.: D-160949<br />
Tech-wise A/S is an intern<strong>at</strong>ional consulting Tech-wise A/S<br />
engineering company specialised Kraftværksvej 53<br />
in energy and environment DK-7000 Fredericia
energy. environment. knowledge. Page 37 of 69<br />
Table 4.2 Weibull shape and scale factors <strong>at</strong> Hvide Sande (27.5 m) and corrected<br />
Weibull parameters for <strong>Horns</strong> <strong>Rev</strong> (62 m), January 1989 to October 2002<br />
Hvide Sande <strong>Horns</strong> <strong>Rev</strong><br />
Sector A k % A k %<br />
mean 8.06 2.24 100.0 11.05 2.34 100.0<br />
N 5.49 1.92 3.8 8.71 2.08 3.8<br />
NNE 6.54 2.08 4.3 9.36 2.22 4.3<br />
ENE 7.55 2.46 5.5 9.29 2.41 5.5<br />
E 8.68 2.79 8.3 10.27 2.37 8.3<br />
ESE 8.14 2.43 8.7 10.89 2.51 8.7<br />
SSE 6.84 2.38 6.7 10.49 2.75 6.7<br />
S 7.33 2.41 8.4 10.94 2.61 8.4<br />
SSW 7.91 2.50 10.5 11.23 2.51 10.5<br />
WSW 8.70 2.34 11.4 11.93 2.33 11.4<br />
W 8.89 2.20 12.2 11.94 2.35 12.2<br />
WNW 9.30 2.32 13.9 12.17 2.58 13.9<br />
NNW 6.99 2.03 6.1 10.31 2.01 6.1<br />
Mean <strong>Wind</strong> Speed Hvide Sande 7.1 m/s<br />
Mean <strong>Wind</strong> Speed <strong>Horns</strong> <strong>Rev</strong> 9.7 m/s<br />
4.2.2 Measure-correl<strong>at</strong>e-predict (MCP)<br />
The MCP extrapol<strong>at</strong>ion methodology assumes a linear rel<strong>at</strong>ionship between wind<br />
speeds <strong>at</strong> paired sites, where one site with long-term records acts as a predictor, and the<br />
wind speeds <strong>at</strong> a short-term measurement site are the predictand. Once a regression<br />
equ<strong>at</strong>ion has been conditioned-based on the measurement overlap period, the regression<br />
equ<strong>at</strong>ion parameters can be used to derive an extended d<strong>at</strong>a record for the site of interest<br />
(the predictand site).<br />
Here this method is employed using one regression equ<strong>at</strong>ion for each wind direction<br />
sector. The methodology used is:<br />
1. Produce a d<strong>at</strong>a set containing wind speeds and directions from Hvide Sande <strong>at</strong><br />
27.5 m and from <strong>Horns</strong> <strong>Rev</strong> <strong>at</strong> 62 m with complete d<strong>at</strong>a overlap (th<strong>at</strong> is no<br />
missing observ<strong>at</strong>ions <strong>at</strong> either site). Assess whether the correl<strong>at</strong>ion between the<br />
wind speeds <strong>at</strong> the two sites is adequ<strong>at</strong>e to characterise the rel<strong>at</strong>ionship Figure<br />
4.1. In this analysis all correl<strong>at</strong>ion coefficients were in excess of 0.79 Table 4.3.<br />
2. Use the d<strong>at</strong>a to gener<strong>at</strong>e a linear regression equ<strong>at</strong>ion (based on least squares<br />
estim<strong>at</strong>es) for each sector where:<br />
U<strong>Horns</strong> <strong>Rev</strong> = AHvide Sande + B<br />
Report no.: D-160949<br />
Tech-wise A/S is an intern<strong>at</strong>ional consulting Tech-wise A/S<br />
engineering company specialised Kraftværksvej 53<br />
in energy and environment DK-7000 Fredericia
energy. environment. knowledge. Page 38 of 69<br />
A and B are constants. A describes the slope of the regression line and B is the<br />
intercept.<br />
3. Use the constants A and B in the above equ<strong>at</strong>ion with d<strong>at</strong>a measured <strong>at</strong> Hvide<br />
Sande over the period January 1989 to October 2002 to gener<strong>at</strong>e a longer<br />
interpol<strong>at</strong>ed d<strong>at</strong>a series for <strong>Horns</strong> <strong>Rev</strong>. This can be used to calcul<strong>at</strong>e an average<br />
wind speed and as input to the WAsP model to gener<strong>at</strong>e energy density,<br />
potential power production for a given wind turbine, and Weibull shape and<br />
scale parameters. It should be noted th<strong>at</strong> the directions used in the time series are<br />
those from Hvide Sande. Directions from Hvide Sande and <strong>Horns</strong> <strong>Rev</strong> during<br />
the overlap period are compared and shown in Figure 4.2<br />
The regression line can either be fitted through the origin or with an intercept depending<br />
on which gives the best fit to the d<strong>at</strong>a. A summary for all d<strong>at</strong>a using both methods is<br />
given below.<br />
Fit 1: Linear<br />
Equ<strong>at</strong>ion Y = 1.1277 * X + 1.6885<br />
Number of d<strong>at</strong>a points used = 29606<br />
Average X = 6.889<br />
Average Y = 9.458<br />
Coefficient of determin<strong>at</strong>ion, R-squared = 0.7111<br />
Fit 2: Through origin<br />
Equ<strong>at</strong>ion Y = 1.328 * X<br />
Number of d<strong>at</strong>a points used = 29606<br />
Average X = 6.889<br />
Average Y = 9.458<br />
Coefficient of determin<strong>at</strong>ion, R-squared = 0.6836<br />
Since linear fit gives the highest r 2 , this fit has been used in the following analysis, and<br />
is the line shown in Figure 4.1.<br />
Report no.: D-160949<br />
Tech-wise A/S is an intern<strong>at</strong>ional consulting Tech-wise A/S<br />
engineering company specialised Kraftværksvej 53<br />
in energy and environment DK-7000 Fredericia
energy. environment. knowledge. Page 39 of 69<br />
<strong>Wind</strong> speeds <strong>at</strong> <strong>Horns</strong> <strong>Rev</strong> (m/s)<br />
40.00<br />
30.00<br />
20.00<br />
10.00<br />
0.00<br />
y = 1.1277x + 1.6885<br />
R 2 = 0.7111<br />
0.0 10.0 20.0 30.0 40.0<br />
<strong>Wind</strong> speeds <strong>at</strong> Hvide Sande (m/s)<br />
Figure 4.1 <strong>Wind</strong> speeds <strong>at</strong> <strong>Horns</strong> <strong>Rev</strong> (62 m) and Hvide Sande (27.5 m), May 1999 to<br />
October 2002<br />
Report no.: D-160949<br />
Tech-wise A/S is an intern<strong>at</strong>ional consulting Tech-wise A/S<br />
engineering company specialised Kraftværksvej 53<br />
in energy and environment DK-7000 Fredericia
energy. environment. knowledge. Page 40 of 69<br />
<strong>Wind</strong> direction <strong>at</strong> <strong>Horns</strong> <strong>Rev</strong><br />
300<br />
200<br />
100<br />
0<br />
0 100 200 300<br />
<strong>Wind</strong> direction <strong>at</strong>Hvide Sande<br />
y = 0.9555x<br />
R 2 = 0.4131<br />
Figure 4.2 <strong>Wind</strong> direction <strong>at</strong> <strong>Horns</strong> <strong>Rev</strong> and Hvide Sande, May 1999 to October 2002.<br />
The line is a linear fit through the origin where Dir <strong>Horns</strong> <strong>Rev</strong> = Dir Hvide Sande *<br />
0.956. The correl<strong>at</strong>ions coefficient is 0.64<br />
Table 4.3 MCP analysis, May 1999 to October 2002. A is the slope of the regression<br />
line, and B the offset of the regression line<br />
Sector AvgHS AvgHR AvgHR/HS RegCoeff A Offset B Corr.Coef.<br />
m/s m/s -- m/s m/s --<br />
N 4.33 7.45 1.722 1.282 1.901 0.799<br />
NNE 5.44 7.93 1.459 1.125 1.817 0.815<br />
ENE 5.86 7.63 1.304 0.871 2.532 0.820<br />
E 7.70 9.96 1.293 1.060 1.796 0.823<br />
ESE 7.86 10.34 1.315 1.089 1.780 0.855<br />
SSE 6.37 10.17 1.596 1.435 1.030 0.830<br />
S 6.84 10.67 1.560 1.353 1.420 0.894<br />
SSW 7.26 10.80 1.487 1.335 1.108 0.911<br />
WSW 7.32 9.67 1.322 1.227 0.699 0.899<br />
W 7.60 9.09 1.196 1.175 0.160 0.894<br />
WNW 8.26 9.85 1.194 1.126 0.561 0.895<br />
NNW 5.71 8.90 1.558 1.265 1.670 0.834<br />
These regression coefficients are applied to the long time series <strong>at</strong> Hvide Sande to give<br />
an estim<strong>at</strong>e of the long-term mean wind parameters <strong>at</strong> <strong>Horns</strong> <strong>Rev</strong>. This gives a mean<br />
Report no.: D-160949<br />
Tech-wise A/S is an intern<strong>at</strong>ional consulting Tech-wise A/S<br />
engineering company specialised Kraftværksvej 53<br />
in energy and environment DK-7000 Fredericia
energy. environment. knowledge. Page 41 of 69<br />
wind speed of 9.67 m/s, Weibull A parameters of 10.8 m/s and Weibull k parameter of<br />
2.5.<br />
4.3 Comparison with previous estim<strong>at</strong>es<br />
Table 4.4 shows a comparison of wind speeds and Weibull factors gener<strong>at</strong>ed for this<br />
analysis, and a comparison with previous estim<strong>at</strong>es from [4], [5] and [6].<br />
The results contained in this report are in good agreement with those obtained<br />
previously, although it should be noted th<strong>at</strong> the measured values are lower than the<br />
long-term mean. Please note th<strong>at</strong> nearly 30,000 records were used in the analysis – onsite<br />
measurements were not used in [4] and [5].<br />
Table 4.4 Comparison of wind resource estim<strong>at</strong>es of wind speeds <strong>at</strong> <strong>Horns</strong> <strong>Rev</strong><br />
Method D<strong>at</strong>a Source U 48 m A k<br />
Energy density<br />
48m<br />
(m/s) (m/s) (W/m^2)<br />
<strong>Horns</strong> <strong>Rev</strong><br />
Best estim<strong>at</strong>e Lightship (Højstrup et al., 1997) 9.1 10.2 2.2 800<br />
<strong>Horns</strong> <strong>Rev</strong><br />
WAsP Lightship (Barthelmie et al., 1998) 9.2 10.4 2.2 844<br />
WAsP Tjæreborg (Barthelmie et al., 1998) 9.72 11 2.4 933<br />
<strong>Horns</strong> <strong>Rev</strong><br />
Best estim<strong>at</strong>e Lightship (Barthelmie et al., 1998) 9.2 10.4 2.3 810<br />
Method D<strong>at</strong>a Source U 62 m A k<br />
MCP<br />
MCP<br />
MCP<br />
Weibull<br />
<strong>Horns</strong> <strong>Rev</strong> 99-01<br />
/ Juvre met mast Tech-wise report no. 01-079 2001<br />
<strong>Horns</strong> <strong>Rev</strong> 99-01<br />
/ Tjæreborg met<br />
9.94<br />
mast Tech-wise report no. 01-079 2001 10.1<br />
<strong>Horns</strong> <strong>Rev</strong> 99-01<br />
/ Hvide Sande Tech-wise report no. 01-078 2001 9.72<br />
Energy density<br />
48m<br />
(m/s) (m/s) (W/m^2)<br />
<strong>Horns</strong> <strong>Rev</strong> 99-02<br />
/ Hvide Sande This report 9.79 11.05 2.34 898<br />
<strong>Horns</strong> <strong>Rev</strong> 99-02<br />
MCP / Hvide Sande This report 9.67 10.8 2.5 801<br />
Observed <strong>Horns</strong> <strong>Rev</strong> 99-02 This report 9.49 10.71 2.33 820<br />
Best estim<strong>at</strong>e<br />
<strong>Horns</strong> <strong>Rev</strong> 99-02<br />
/ Hvide Sande This report 9.79<br />
Report no.: D-160949<br />
Tech-wise A/S is an intern<strong>at</strong>ional consulting Tech-wise A/S<br />
engineering company specialised Kraftværksvej 53<br />
in energy and environment DK-7000 Fredericia
energy. environment. knowledge. Page 42 of 69<br />
5. Stability and clim<strong>at</strong>e<br />
The <strong>at</strong>mospheric stability is a derived quantity, which is based on the Richardson<br />
number, as defined by the formula:<br />
The temper<strong>at</strong>ure difference is based on temper<strong>at</strong>ure recordings from level 13 and 55 m,<br />
while the wind speed difference is based on wind speeds from level 15 and 45 m:<br />
Table 5.1 Stability distribution for 5 = CUP62M < 25 m/s<br />
Stability Interval Distribution<br />
Very stable 0.12 = Ri < 1 37%<br />
Stable 0.045 = Ri < 0.12 11%<br />
Near neutral -0.06 = Ri < 0.045 9%<br />
Unstable -0.30 = Ri < -0.06 12%<br />
Very unstable -2.00 = Ri < -0.30 31%<br />
The stability analysis is based on 11,550 hours of measurements recorded in the wind<br />
speed interval 5–25 m/s, and Figure 5.1 shows the stability distribution representing the<br />
<strong>Horns</strong> <strong>Rev</strong> site, according to the definition given in Table 5.1.<br />
pdf [%]<br />
40<br />
30<br />
20<br />
10<br />
Ri<br />
5.1 Shear exponent distribution<br />
0<br />
Very stable<br />
g Δt<br />
Δh<br />
= ×<br />
T ( ΔV<br />
Δh<br />
2<br />
)<br />
Stability measured <strong>at</strong> <strong>Horns</strong> <strong>Rev</strong><br />
5 < CUP62M < 25 m/s<br />
Slightly stable<br />
Near neutral<br />
Slightly unstable<br />
Figure 5.1 Stability distribution<br />
Very unstable<br />
The shear exponent a is a derived quantity, which is used to represent the mean wind<br />
gradient:<br />
Report no.: D-160949<br />
Tech-wise A/S is an intern<strong>at</strong>ional consulting Tech-wise A/S<br />
engineering company specialised Kraftværksvej 53<br />
in energy and environment DK-7000 Fredericia
energy. environment. knowledge. Page 43 of 69<br />
V h<br />
= V<br />
10<br />
⎡ h ⎤<br />
×<br />
⎢ ⎥<br />
⎣10<br />
⎦<br />
The shear exponent is fitted for each 10-min period, based on free, undistrubed wind<br />
speed signals <strong>at</strong> levels 15, 30, 45 and 62 m. The average shear exponents, with reference<br />
to the wind speed <strong>at</strong> level 62 m, are listed in Table 5.2 for each wind speed bin.<br />
Table 5.2 Bin average wind shear exponent.<br />
Interval Hours < a ><br />
4 < V62 ≤ 6 m/s 3140 0.10<br />
6 < V62 ≤ 8 m/s 4018 0.12<br />
8 < V62 ≤ 10 m/s 4400 0.13<br />
10 < V62 ≤ 12 m/s 3950 0.12<br />
12 < V62 ≤ 14 m/s 2963 0.12<br />
14 < V62 ≤ 16 m/s 1994 0.12<br />
16 < V62 ≤ 18 m/s 1222 0.11<br />
18 < V62 ≤ 20 m/s 589 0.12<br />
V62 > 20 m/s 413 0.12<br />
The wind shear exponent distribution for two wind speed intervals has been determined<br />
and Figure 5.2 shows the distributions.<br />
Figure 5.2 Distribution of shear exponent <strong>at</strong> <strong>Horns</strong> <strong>Rev</strong><br />
5.2 Distribution of gusts<br />
The maximum 10-min speed values lasting 1 and 5 s have been recorded. The analysed<br />
d<strong>at</strong>a represents 23,538 hours of measurements for wind speeds higher than 4.5 m/s. The<br />
gust size presented in this section is the difference between the short-term maximum<br />
value and the 10-min mean wind speed.<br />
α<br />
Report no.: D-160949<br />
Tech-wise A/S is an intern<strong>at</strong>ional consulting Tech-wise A/S<br />
engineering company specialised Kraftværksvej 53<br />
in energy and environment DK-7000 Fredericia
energy. environment. knowledge. Page 44 of 69<br />
The bin averaged gust size, as a function of wind speed is shown on Figure 5.3 a, where<br />
only a small amount of d<strong>at</strong>a is recorded <strong>at</strong> wind speeds above 35 m/s (during the<br />
December storm in 1999).<br />
The distributions of 5-s gusts <strong>at</strong> level 62 m have been determined for 4 different wind<br />
speed intervals (V > 10 m/s) based on the figures given in Table 5.3.<br />
Table 5.3 Number of hours in each wind speed interval<br />
Interval Hours<br />
10 < V < 15 m/s 8506 hours<br />
15 < V < 20 m/s 2791 hours<br />
20 < V < 25 m/s 365 hours<br />
25 < V 47 hours<br />
Figure 5.3 Distributions of gusts with a reference period of 5 s, for each wind speed<br />
interval<br />
Report no.: D-160949<br />
Tech-wise A/S is an intern<strong>at</strong>ional consulting Tech-wise A/S<br />
engineering company specialised Kraftværksvej 53<br />
in energy and environment DK-7000 Fredericia
energy. environment. knowledge. Page 45 of 69<br />
6. <strong>Wind</strong>-wave-roughness<br />
Wave measurements have been made simultaneously with meteorological<br />
measurements <strong>at</strong> the <strong>Horns</strong> <strong>Rev</strong> site. Site and wind d<strong>at</strong>a are described in section 1.<br />
Simultaneous wind and wave d<strong>at</strong>a are available from June 1999 to November 2002.<br />
The wave-measuring instrument is a Waverider. The Waverider is a buoy which,<br />
following the movements of the w<strong>at</strong>er surface, measures waves by measuring the<br />
vertical acceler<strong>at</strong>ion of the buoy. The discrepancy between the vertical movements of<br />
the Waverider and the movements of the sea surface is small. When a moored<br />
Waverider follows the waves, the force of the mooring line will change. This force is<br />
produced by the changing immersion of the buoy, resulting in an error of max 1.5%.<br />
The measurements are transferred onshore via a HF radio link, stored in the d<strong>at</strong>abase,<br />
and displayed on the web page http;//212.130.241.250/hornsrev/ within less than one<br />
hour. In the first phase of the measuring period, there were two Waveriders oper<strong>at</strong>ing<br />
simultaneously, see<br />
Figure 6.1<br />
Report no.: D-160949<br />
Tech-wise A/S is an intern<strong>at</strong>ional consulting Tech-wise A/S<br />
engineering company specialised Kraftværksvej 53<br />
in energy and environment DK-7000 Fredericia
energy. environment. knowledge. Page 46 of 69<br />
Figure 6.1 Loc<strong>at</strong>ion of marine measurements of wave (Waverider) and current<br />
(Workhorse) <strong>at</strong> <strong>Horns</strong> <strong>Rev</strong><br />
Report no.: D-160949<br />
Tech-wise A/S is an intern<strong>at</strong>ional consulting Tech-wise A/S<br />
engineering company specialised Kraftværksvej 53<br />
in energy and environment DK-7000 Fredericia
energy. environment. knowledge. Page 47 of 69<br />
Figure 6.2 Waverider used for wave height measurements<br />
The current-measuring instrument is a Workhorse Sentinel ADCP. The Workhorse is an<br />
Acoustic Doppler Current Profiler th<strong>at</strong> when placed on the seabed sends acoustic<br />
signals up towards the surface. Acoustic reflections from the w<strong>at</strong>er particles are<br />
transformed to current measurements.<br />
Figure 6.3 Workhorse Sentinel ADCP used for current measurements<br />
6.1 Marine d<strong>at</strong>a overview<br />
Table 6.1 D<strong>at</strong>a coverage for the marine measurements systems<br />
Measuring System D<strong>at</strong>a Period Hours D<strong>at</strong>a Coverage<br />
Waverider South 1999.07.01 2002.12.12 30242 80.52%<br />
Waverider North 1999.07.01 2000.08.31 10246 91.01%<br />
Workhorse ADCP 1999.07.01 2002.10.25 29087 64.34%<br />
Report no.: D-160949<br />
Tech-wise A/S is an intern<strong>at</strong>ional consulting Tech-wise A/S<br />
engineering company specialised Kraftværksvej 53<br />
in energy and environment DK-7000 Fredericia
energy. environment. knowledge. Page 48 of 69<br />
6.2 Marine st<strong>at</strong>istics<br />
Table 6.2 gives an overview of the most important parameters measured st<strong>at</strong>ing the<br />
mean and maximum values. The WL is referred to the DNN (Danish Normal Zero)<br />
system.<br />
Table 6.2 Mean and max. values of the most interesting marine parameters recorded<br />
Waverider South<br />
(note th<strong>at</strong> Hmax has only been<br />
measured since Nov. 1, 1999)<br />
Waverider North<br />
(note th<strong>at</strong> Hmax has only been<br />
measured since Nov. 1, 1999)<br />
Current<br />
(middle of w<strong>at</strong>er column)<br />
W<strong>at</strong>er Level<br />
(rel. to DNN)<br />
6.2.1 Time series plots<br />
Unit Mean Max.<br />
Hs 1.09 m 4.32 m<br />
Hmax 1.65m 7.64 m<br />
T02 4.11 s 8.30 s<br />
Tp 6.22 s 25.0 s<br />
Hs 1.29 m 4.48 m<br />
Hmax 2.55 m 7.40 m<br />
T02 4.32 s 8.17 s<br />
Tp 6.74 s 16.7 s<br />
Abs. current 0.35 m/s 0.91 m/s<br />
North Component -0.85 m/s / 0.83 m/s<br />
East Component -0.42 m/s / 0.75 m/s<br />
0.49 m -1.31 m / 2.80 m<br />
Two examples of time series of wind speeds <strong>at</strong> a height of 15 m, wind directions and<br />
significant wave heights are shown in Figure 6.4 and Figure 6.5. The plots show<br />
rel<strong>at</strong>ively good agreement between wave height and wind speed.<br />
Report no.: D-160949<br />
Tech-wise A/S is an intern<strong>at</strong>ional consulting Tech-wise A/S<br />
engineering company specialised Kraftværksvej 53<br />
in energy and environment DK-7000 Fredericia
energy. environment. knowledge. Page 49 of 69<br />
<strong>Wind</strong> direction<br />
<strong>Wind</strong> Speed 15m<br />
350<br />
300<br />
250<br />
200<br />
150<br />
100<br />
50<br />
0<br />
14.0<br />
12.0<br />
10.0<br />
8.0<br />
6.0<br />
4.0<br />
2.0<br />
0.0<br />
2002-08-31 12:00<br />
2002-09-01 00:00<br />
2002-09-01 12:00<br />
2002-09-02 00:00<br />
2002-09-02 12:00<br />
2002-09-03 00:00<br />
2002-09-03 12:00<br />
2002-09-04 00:00<br />
<strong>Wind</strong> Speed 15m<br />
Wave Height Hs<br />
2002-09-04 12:00<br />
2002-09-05 00:00<br />
2002-09-05 12:00<br />
Figure 6.4 Example of a time series of wind speeds <strong>at</strong> 15 m, wind directions and<br />
significant wave heights <strong>at</strong> <strong>Horns</strong> <strong>Rev</strong>, September 1–5, 2002<br />
Report no.: D-160949<br />
Tech-wise A/S is an intern<strong>at</strong>ional consulting Tech-wise A/S<br />
engineering company specialised Kraftværksvej 53<br />
in energy and environment DK-7000 Fredericia<br />
2.5<br />
2.0<br />
1.5<br />
1.0<br />
0.5<br />
0.0<br />
Wave Height Hs
energy. environment. knowledge. Page 50 of 69<br />
<strong>Wind</strong> direction<br />
<strong>Wind</strong> Speed 15m<br />
350<br />
300<br />
250<br />
200<br />
150<br />
100<br />
50<br />
0<br />
18.0<br />
16.0<br />
14.0<br />
12.0<br />
10.0<br />
8.0<br />
6.0<br />
4.0<br />
2.0<br />
0.0<br />
2001-08-26 12:00<br />
Figure 6.5 Example of a time series of wind speeds <strong>at</strong> 15 m, wind directions and<br />
significant wave heights <strong>at</strong> <strong>Horns</strong> <strong>Rev</strong>, August 27–31, 2001<br />
6.2.2 Waves<br />
2001-08-27 00:00<br />
2001-08-27 12:00<br />
2001-08-28 00:00<br />
2001-08-28 12:00<br />
2001-08-29 00:00<br />
2001-08-29 12:00<br />
2001-08-30 00:00<br />
<strong>Wind</strong> Speed 15m<br />
Wave Height Hs<br />
2001-08-30 12:00<br />
2001-08-31 00:00<br />
2001-08-31 12:00<br />
The distribution of the significant wave height is shown in Figure 6.6, the same figure<br />
also shows the Log Normal distribution with parameters a1 = 0.35 and a2 = 0.55. The<br />
distribution is based on more than 14,000 hours of d<strong>at</strong>a recorded from July 1999 to<br />
November 2002.<br />
Report no.: D-160949<br />
Tech-wise A/S is an intern<strong>at</strong>ional consulting Tech-wise A/S<br />
engineering company specialised Kraftværksvej 53<br />
in energy and environment DK-7000 Fredericia<br />
2.5<br />
2.0<br />
1.5<br />
1.0<br />
0.5<br />
0.0<br />
Wave Height Hs
energy. environment. knowledge. Page 51 of 69<br />
pdf[%]<br />
7<br />
6<br />
5<br />
4<br />
3<br />
2<br />
1<br />
0<br />
Measure<br />
LogNormal<br />
0 1 2 3 4 5 6 7<br />
Significant Wave Hight [m]<br />
Figure 6.6 Probability distributions of significant wave height Hs<br />
The distribution of the mean wave height is shown in Figure 6.7 the same figure also<br />
shows the Log Normal distribution with parameters a1 = -0.15 and a2 = 0.60.<br />
Report no.: D-160949<br />
Tech-wise A/S is an intern<strong>at</strong>ional consulting Tech-wise A/S<br />
engineering company specialised Kraftværksvej 53<br />
in energy and environment DK-7000 Fredericia
energy. environment. knowledge. Page 52 of 69<br />
pdf [%]<br />
10<br />
9<br />
8<br />
7<br />
6<br />
5<br />
4<br />
3<br />
2<br />
1<br />
0<br />
Measure<br />
LogNormal<br />
0 1 2 3 4 5<br />
Mean Wave Hight<br />
Figure 6.7 Probability distributions of mean wave height Hmean<br />
Since waves are gener<strong>at</strong>ed by the wind shear and wind pressure on the sea surface, a<br />
clear dependency on these two phenomena can be expected. Figure 6.9 illustr<strong>at</strong>es this<br />
rel<strong>at</strong>ionship between the wind speed (1 hour average) in level 62 and the significant<br />
wave height Hm0. In addition to the wind speed it is evident from this figure th<strong>at</strong> also the<br />
fetch plays an important role for the wave gener<strong>at</strong>ion, waves being smaller from eastern<br />
directions where the fetch is limited (15–40 km). The pronounced sc<strong>at</strong>ter in the figure<br />
can mainly be contributed to the fact th<strong>at</strong> the waves do not react instantaneously to fast<br />
changes in wind speed.<br />
Report no.: D-160949<br />
Tech-wise A/S is an intern<strong>at</strong>ional consulting Tech-wise A/S<br />
engineering company specialised Kraftværksvej 53<br />
in energy and environment DK-7000 Fredericia
energy. environment. knowledge. Page 53 of 69<br />
Significant wave height [m]<br />
4<br />
3.5<br />
3<br />
2.5<br />
2<br />
1.5<br />
1<br />
0.5<br />
0<br />
0 1 2 3 4 5 6 7 8 9 10 11 12 13 14 15 16 17 18 19 20 21 22 23 24 25 26 27<br />
<strong>Wind</strong> speed <strong>at</strong> kote 15 [m/s]<br />
Figure 6.8 Significant mean wave height versus wind speed bin <strong>at</strong> level 15 m<br />
Dependencies between different parameters are less distorted by devi<strong>at</strong>ions between<br />
measurement period and long-term average than probability distributions. Therefore,<br />
sc<strong>at</strong>ter plots are useful to valid<strong>at</strong>e model results for the measured parameters. Plots<br />
showing the dependency of wave on parameters on wind speed and direction are given<br />
in Figure 6.9 and for each sector in Figure 6.10 and Figure 6.11.<br />
Report no.: D-160949<br />
Tech-wise A/S is an intern<strong>at</strong>ional consulting Tech-wise A/S<br />
engineering company specialised Kraftværksvej 53<br />
in energy and environment DK-7000 Fredericia
energy. environment. knowledge. Page 54 of 69<br />
Wave height Hm0 [m]<br />
5<br />
4<br />
3<br />
2<br />
1<br />
0<br />
0 10 20 30 40 50<br />
<strong>Wind</strong> speed [m/s]<br />
Figure 6.9 Measured rel<strong>at</strong>ionships <strong>at</strong> <strong>Horns</strong> <strong>Rev</strong> (Waverider south) between wind<br />
speeds (level 62) and significant wave heights for 12 directions. May 1999<br />
to November 2002<br />
For wind speeds up to about 20 m/s, there is an almost linear rel<strong>at</strong>ionship between wind<br />
speed and wave height. For higher winds, the waves seem to reach an upper limit of<br />
about 4 m. This limit is governed by the w<strong>at</strong>er depth which, when sufficiently shallow,<br />
forces the waves to break. Hence the extreme wave conditions are not limited by the<br />
wind, but r<strong>at</strong>her by the w<strong>at</strong>er level.<br />
The rel<strong>at</strong>ionship between the significant wave height Hm0 and the maximum wave<br />
height Hmax is illustr<strong>at</strong>ed in Figure 6.12 by the r<strong>at</strong>io Hmax/Hm0. Despite the inherent<br />
sc<strong>at</strong>ter, a weak trend towards a falling Hmax/Hm0-r<strong>at</strong>io can be observed for higher waves.<br />
This can again be explained by breaking of the largest waves.<br />
Report no.: D-160949<br />
Tech-wise A/S is an intern<strong>at</strong>ional consulting Tech-wise A/S<br />
engineering company specialised Kraftværksvej 53<br />
in energy and environment DK-7000 Fredericia<br />
N<br />
NNE<br />
ENE<br />
E<br />
ESE<br />
SSE<br />
S<br />
SSW<br />
WSW<br />
W<br />
WNW<br />
NNW
energy. environment. knowledge. Page 55 of 69<br />
Hm0 (m)<br />
Hm0 (m)<br />
Hm0 (m)<br />
<strong>Wind</strong> direction N y = 0.1108x<br />
5.0<br />
4.5<br />
4.0<br />
3.5<br />
3.0<br />
2.5<br />
2.0<br />
1.5<br />
1.0<br />
0.5<br />
0.0<br />
0 10 20 30<br />
WS62 (m/s)<br />
<strong>Wind</strong> direction ENE<br />
y = 0.0917x<br />
5.0<br />
4.5<br />
4.0<br />
3.5<br />
3.0<br />
2.5<br />
2.0<br />
1.5<br />
1.0<br />
0.5<br />
0.0<br />
0 10 20 30<br />
WS62 (m/s)<br />
<strong>Wind</strong> direction ESE<br />
y = 0.0795x<br />
5.0<br />
4.5<br />
4.0<br />
3.5<br />
3.0<br />
2.5<br />
2.0<br />
1.5<br />
1.0<br />
0.5<br />
0.0<br />
0 10 20 30<br />
WS62 (m/s)<br />
Hm0 (m)<br />
Hm0 (m)<br />
Hm0 (m)<br />
<strong>Wind</strong> direction NNE y = 0.1059x<br />
5.0<br />
4.5<br />
4.0<br />
3.5<br />
3.0<br />
2.5<br />
2.0<br />
1.5<br />
1.0<br />
0.5<br />
0.0<br />
0 10 20 30<br />
WS62 (m/s)<br />
<strong>Wind</strong> direction E<br />
y = 0.0781x<br />
5.0<br />
4.5<br />
4.0<br />
3.5<br />
3.0<br />
2.5<br />
2.0<br />
1.5<br />
1.0<br />
0.5<br />
0.0<br />
0 10 20 30<br />
WS62 (m/s)<br />
<strong>Wind</strong> direction SSE<br />
y = 0.0987x<br />
5.0<br />
4.5<br />
4.0<br />
3.5<br />
3.0<br />
2.5<br />
2.0<br />
1.5<br />
1.0<br />
0.5<br />
0.0<br />
0 10 20 30<br />
WS62 (m/s)<br />
Figure 6.10 <strong>Wind</strong> speed <strong>at</strong> 62 m height versus significant wave heights for each sector<br />
of wind direction<br />
Report no.: D-160949<br />
Tech-wise A/S is an intern<strong>at</strong>ional consulting Tech-wise A/S<br />
engineering company specialised Kraftværksvej 53<br />
in energy and environment DK-7000 Fredericia
energy. environment. knowledge. Page 56 of 69<br />
Hm0 (m)<br />
Hm0 (m)<br />
Hm0 (m)<br />
<strong>Wind</strong> direction S<br />
y = 0.1133x<br />
5.0<br />
4.5<br />
4.0<br />
3.5<br />
3.0<br />
2.5<br />
2.0<br />
1.5<br />
1.0<br />
0.5<br />
0.0<br />
0 10 20 30<br />
WS62 (m/s)<br />
<strong>Wind</strong> direction WSW<br />
5.0<br />
4.5<br />
4.0<br />
3.5<br />
3.0<br />
2.5<br />
2.0<br />
1.5<br />
1.0<br />
0.5<br />
0.0<br />
y = 0.1326x<br />
0 10 20 30<br />
WS62 (m/s)<br />
<strong>Wind</strong> direction WNW<br />
y = 0.1321x<br />
5.0<br />
4.5<br />
4.0<br />
3.5<br />
3.0<br />
2.5<br />
2.0<br />
1.5<br />
1.0<br />
0.5<br />
0.0<br />
0 10 20 30<br />
WS62 (m/s)<br />
Hm0 (m)<br />
Hm0 (m)<br />
Hm0 (m)<br />
<strong>Wind</strong> direction SSW<br />
y = 0.1211x<br />
5.0<br />
4.5<br />
4.0<br />
3.5<br />
3.0<br />
2.5<br />
2.0<br />
1.5<br />
1.0<br />
0.5<br />
0.0<br />
0 10 20 30<br />
WS62 (m/s)<br />
<strong>Wind</strong> direction W<br />
5.0<br />
4.5<br />
4.0<br />
3.5<br />
3.0<br />
2.5<br />
2.0<br />
1.5<br />
1.0<br />
0.5<br />
0.0<br />
y = 0.1338x<br />
0 10 20 30<br />
WS62 (m/s)<br />
<strong>Wind</strong> direction NNW y = 0.1207x<br />
5.0<br />
4.5<br />
4.0<br />
3.5<br />
3.0<br />
2.5<br />
2.0<br />
1.5<br />
1.0<br />
0.5<br />
0.0<br />
0 10 20 30<br />
WS62 (m/s)<br />
Figure 6.11 <strong>Wind</strong> speed <strong>at</strong> 62 m height versus significant wave heights for each sector<br />
of wind direction<br />
Report no.: D-160949<br />
Tech-wise A/S is an intern<strong>at</strong>ional consulting Tech-wise A/S<br />
engineering company specialised Kraftværksvej 53<br />
in energy and environment DK-7000 Fredericia
energy. environment. knowledge. Page 57 of 69<br />
Hmax/Hmo<br />
3<br />
2.5<br />
2<br />
1.5<br />
1<br />
0.5<br />
0<br />
0 1 2 3 4 5<br />
Hmo (m)<br />
Figure 6.12 R<strong>at</strong>io between Hmax and Hm0 (Waverider south d<strong>at</strong>a), May 1999 to<br />
November 2002<br />
Figure 6.13 shows the rel<strong>at</strong>ionship between wave height (Hm0) and wave period (T02).<br />
The measured values can roughly be regarded as grouped in two clusters; an upper<br />
cluster where waves are gener<strong>at</strong>ed by the wind and a lower cluster (Hm0 ≈ 0.5 m) where<br />
the waves origin<strong>at</strong>e from swells.<br />
The wind gener<strong>at</strong>ed part of the waves shows th<strong>at</strong> there is a well-defined rel<strong>at</strong>ionship<br />
between wave height and wave period.<br />
Report no.: D-160949<br />
Tech-wise A/S is an intern<strong>at</strong>ional consulting Tech-wise A/S<br />
engineering company specialised Kraftværksvej 53<br />
in energy and environment DK-7000 Fredericia
energy. environment. knowledge. Page 58 of 69<br />
Wave height Hm0 [m]<br />
5<br />
4<br />
3<br />
2<br />
1<br />
0<br />
0 2 4 6 8 10<br />
Wave period T02 [s]<br />
Figure 6.13 Rel<strong>at</strong>ionship between Hm0 and T02 (Waverider south), May 1999 to<br />
November 2002<br />
Finally, the exceedence of probabilities of the significant wave heights measured <strong>at</strong> pos.<br />
south is plotted in Figure 6.14.<br />
Report no.: D-160949<br />
Tech-wise A/S is an intern<strong>at</strong>ional consulting Tech-wise A/S<br />
engineering company specialised Kraftværksvej 53<br />
in energy and environment DK-7000 Fredericia
energy. environment. knowledge. Page 59 of 69<br />
Exceedance Probability<br />
100%<br />
90%<br />
80%<br />
70%<br />
60%<br />
50%<br />
40%<br />
30%<br />
20%<br />
10%<br />
0%<br />
Figure 6.14 Probability of exceedence for measured significant wave heights <strong>at</strong><br />
positions south, May 1999 to November 2002<br />
A key point in selecting the right oper<strong>at</strong>ion and maintenance (O&M) str<strong>at</strong>egy for an<br />
offshore wind farm, is the accessibility of the wind turbines. The most n<strong>at</strong>ural choice of<br />
transport for offshore oper<strong>at</strong>ions is by bo<strong>at</strong>. However, with a limiting wave height of<br />
Hs=1.2-1.3 m for bo<strong>at</strong> oper<strong>at</strong>ions, it can be seen from Figure 6.17 th<strong>at</strong> the accessibility<br />
is only approx. 60%.<br />
6.2.3 Currents<br />
0.0 0.5 1.0 1.5 2.0 2.5 3.0<br />
Significant wave height [m]<br />
The <strong>Horns</strong> <strong>Rev</strong> site is domin<strong>at</strong>ed by a N-S flowing tidal current with maximum<br />
velocities of about 1 m/s. In extreme storm conditions with winds from the west, the<br />
wind induced current in the eastward direction has been measured to nearly 0.8 m/s (the<br />
December 3, 1999 hurricane).<br />
Report no.: D-160949<br />
Tech-wise A/S is an intern<strong>at</strong>ional consulting Tech-wise A/S<br />
engineering company specialised Kraftværksvej 53<br />
in energy and environment DK-7000 Fredericia
energy. environment. knowledge. Page 60 of 69<br />
Figure 6.15 Measured current magnitudes [m/s] and flow directions [°], July 1999 to<br />
December 2000<br />
Current profiles are shown in Figure 6.16. The blue line (WL) is the mean w<strong>at</strong>er level<br />
for the sample period of 15 min. waves on the surface results in the vari<strong>at</strong>ion of the<br />
profile above the read line (maxbin). The workhorse can only make valid measurements<br />
approxim<strong>at</strong>ely 1.5 m above its position <strong>at</strong> the seabed. Valid measurements are shown in<br />
Figure 6.16 from the red line to level -5.5 m.<br />
21.07.99 20:16<br />
N<br />
E<br />
WL<br />
Maxbin<br />
2<br />
1<br />
0<br />
-1<br />
-2<br />
-3<br />
-4<br />
-5<br />
-6<br />
-7<br />
-600 -300 0 300 600<br />
21.07.99 17:16<br />
N<br />
E<br />
WL<br />
Maxbin<br />
2<br />
1<br />
0<br />
-1<br />
-2<br />
-3<br />
-4<br />
-5<br />
-6<br />
-7<br />
-600 -300 0 300 600<br />
Figure 6.16 Plot of current profiles on July 21, 1999. X-axis Current [mm/s] Y-axis<br />
level [m]<br />
0<br />
0.2<br />
0.4<br />
0.6<br />
0.8<br />
1<br />
Report no.: D-160949<br />
Tech-wise A/S is an intern<strong>at</strong>ional consulting Tech-wise A/S<br />
engineering company specialised Kraftværksvej 53<br />
in energy and environment DK-7000 Fredericia
energy. environment. knowledge. Page 61 of 69<br />
6.3 Numerical simul<strong>at</strong>ions models<br />
Prior to commencing the marine measurement programme, a numerical study was<br />
performed. The aim of this study was primarily to establish estim<strong>at</strong>es of the long-term<br />
extremes of waves, currents, and w<strong>at</strong>er level. However, an important part of the study<br />
was also to estim<strong>at</strong>e the accessibility of the turbines for different limiting sea conditions<br />
(values of Hs) and ”wave window lengths” [11].<br />
The input for this study was a 15-year continuous meteorological d<strong>at</strong>a series covering<br />
the North Sea. These meteorological d<strong>at</strong>a were used as input to the MIKE OSW model<br />
(Danish Hydraulic Institute’s offshore wave model) to simul<strong>at</strong>e a 15-year consecutive<br />
wave train in the proximity of the wind farm. Since the w<strong>at</strong>er depth is r<strong>at</strong>her limited in<br />
and around the wind farm, the OSW waves were used as input to a shallow-w<strong>at</strong>er wave<br />
model, which could then simul<strong>at</strong>e the waves inside the wind farm site.<br />
Table 6.3 lists the extreme value analysis results for 10-, 50- and 100-year return<br />
periods.<br />
Table 6.3 Extreme values from numerical study [11]<br />
Parameter 10-year return period 50-year return period 100-year return period<br />
Hs 5.0 m 5.3 m 5.4 m<br />
Hmax 8.1 m 8.1 m 8.1 m<br />
Currents 0.79 m/s 0.88 m/s 0.92 m/s<br />
W<strong>at</strong>er level -1.7 m / +3.0 m -2.4 m / +3.5 m -2.7 m / +3.7 m<br />
Comparing Table 6.3 with the measured values (Table 6.2) over the 3-year measuring<br />
period, the only divergence observed is th<strong>at</strong> the measured currents exceed the long-term<br />
predictions. However, this is fully expected as the current meter is loc<strong>at</strong>ed close to the<br />
met mast on a w<strong>at</strong>er depth somewh<strong>at</strong> lower than the average w<strong>at</strong>er depth in the wind<br />
farm site, which was used in the numerical simul<strong>at</strong>ions.<br />
The analysis of ”wave windows” was made on a monthly basis. In Figure 6.17 the<br />
accessibility, assuming th<strong>at</strong> Hs permanently has to be below 1.3 m in time periods of 12,<br />
24 and 72 hours, is plotted for each month. The accessibility in the winter season can be<br />
as low as 20% whereas the summer offers an accessibility of 70–80%.<br />
Report no.: D-160949<br />
Tech-wise A/S is an intern<strong>at</strong>ional consulting Tech-wise A/S<br />
engineering company specialised Kraftværksvej 53<br />
in energy and environment DK-7000 Fredericia
energy. environment. knowledge. Page 62 of 69<br />
100%<br />
90%<br />
80%<br />
70%<br />
60%<br />
50%<br />
40%<br />
30%<br />
20%<br />
10%<br />
0%<br />
Accessibility for H s
energy. environment. knowledge. Page 63 of 69<br />
Turbulence intensity <strong>at</strong> kote 15<br />
Turbulence intensity <strong>at</strong> kote 15<br />
0.13<br />
0.12<br />
0.11<br />
0.1<br />
0.09<br />
0.08<br />
0.13<br />
0.12<br />
0.11<br />
0.1<br />
0.09<br />
0.08<br />
0 0.5 1 1.5 2 2.5 3 3.5 4 4.5<br />
Sig. wave height [m]<br />
0 0.5 1 1.5 2 2.5 3 3.5 4 4.5<br />
Sig. wave height [m]<br />
Figure 6.18 Bin averaged turbulence intensity <strong>at</strong> 15 m versus significant wave height<br />
for different wind speed classes<br />
Report no.: D-160949<br />
0-2m/s<br />
2-4m/s<br />
6-8m/s<br />
8-10m/s<br />
10-12m/s<br />
12-14m/s<br />
Tech-wise A/S is an intern<strong>at</strong>ional consulting Tech-wise A/S<br />
engineering company specialised Kraftværksvej 53<br />
in energy and environment DK-7000 Fredericia
energy. environment. knowledge. Page 64 of 69<br />
Turbulence intensity <strong>at</strong> kote 15<br />
Turbulence intensity <strong>at</strong> kote 15<br />
0.13<br />
0.12<br />
0.11<br />
0.1<br />
0.09<br />
0.08<br />
0.13<br />
0.12<br />
0.11<br />
0.1<br />
0.09<br />
0.08<br />
0 0.5 1 1.5 2 2.5 3 3.5 4<br />
Figure 6.19 Bin averaged turbulence intensity <strong>at</strong> 15 m versus significant wave height<br />
for different wind speed classes<br />
7. Extreme events<br />
Sig. wave height [m]<br />
0 0.5 1 1.5 2 2.5 3 3.5 4<br />
Sig. wave height [m]<br />
On December 3, 1999 Denmark was hit by a hurricane exhibiting extremely fierce gusts<br />
- measurements from several places recorded speeds as high as 40-50 m/s. With wind<br />
speeds recorded of this magnitude, the hurricane was the fiercest in Denmark for more<br />
than 100 years.<br />
The <strong>Horns</strong> <strong>Rev</strong> site was hit by the hurricane in the afternoon with wind speeds (10-min.<br />
avg.) increasing from 15 m/s <strong>at</strong> noon to more than 45 m/s <strong>at</strong> 18.00 hours. The measured<br />
Report no.: D-160949<br />
14-16m/s<br />
16-18m/s<br />
18-20m/s<br />
20-22m/s<br />
22-24m/s<br />
24-26m/s<br />
Tech-wise A/S is an intern<strong>at</strong>ional consulting Tech-wise A/S<br />
engineering company specialised Kraftværksvej 53<br />
in energy and environment DK-7000 Fredericia
energy. environment. knowledge. Page 65 of 69<br />
maximum 1 Hz value of 58.5 m/s and a maximum 5-s running mean value of 53.4 m/s<br />
indic<strong>at</strong>e very high gust values.<br />
<strong>Wind</strong> Speed [m/s]<br />
70<br />
60<br />
50<br />
40<br />
30<br />
20<br />
10<br />
0<br />
10 min average<br />
5 sec average<br />
max wind speed<br />
Air press.<br />
00:00 06:00 12:00 18:00 00:00<br />
Time<br />
1010<br />
1000<br />
Figure 7.1 Measured wind speed level <strong>at</strong> 62 m and air pressure during the passage of<br />
the hurricane, December 3, 1999 - primary met system<br />
Figure 7.1 shows the wind speeds and air pressure <strong>at</strong> the culmin<strong>at</strong>ion of the hurricane.<br />
The zenith of the hurricane lasted for about 2.5 hours, with two peaks divided by a<br />
distinct drop in wind speed in between.<br />
During the storm, parts of the electrical system were pushed out of their sockets - as<br />
earlier mentioned - as large waves, approxim<strong>at</strong>ely 6 m plus 2 meter high w<strong>at</strong>er level,<br />
impinged on the walls of the measurement shed loc<strong>at</strong>ed <strong>at</strong> level 6.2 <strong>at</strong> about 23.50<br />
hours. This caused disconnection of the power supply to the primary measuring system,<br />
and hence a total system shut-down of the primary met system for the following 10<br />
days.<br />
990<br />
980<br />
970<br />
960<br />
950<br />
940<br />
Report no.: D-160949<br />
Air Pressure [hpa]<br />
Tech-wise A/S is an intern<strong>at</strong>ional consulting Tech-wise A/S<br />
engineering company specialised Kraftværksvej 53<br />
in energy and environment DK-7000 Fredericia
energy. environment. knowledge. Page 66 of 69<br />
H (m)<br />
7.0<br />
6.0<br />
5.0<br />
4.0<br />
3.0<br />
2.0<br />
1.0<br />
0.0<br />
03-12 03-12 03-12 03-12 03-12 03-12 03-12 03-12 03-12 03-12 03-12 03-12 04-12 04-12 04-12 04-12 04-12 04-12 04-12 04-12 04-12 04-12 04-12 04-12 05-12<br />
00:00 02:00 04:00 06:00 08:00 10:00 12:00 14:00 16:00 18:00 20:00 22:00 00:00 02:00 04:00 06:00 08:00 10:00 12:00 14:00 16:00 18:00 20:00 22:00 00:00<br />
Time (UCT, add 1 hour to get Danish Winter Time)<br />
Figure 7.2 Waves and w<strong>at</strong>er level during the hurricane December 3–4, 1999<br />
W<strong>at</strong>er level above DNN (cm)<br />
300.0<br />
250.0<br />
200.0<br />
150.0<br />
100.0<br />
50.0<br />
W<strong>at</strong>er level<br />
Curr. Level +0.67<br />
Curr. Level -0.87<br />
Curr. Level -2.87<br />
Figure 7.3 W<strong>at</strong>er level and current during the hurricane December 3–4, 1999<br />
Hs_north<br />
Hs_south<br />
Hmax_north<br />
Hmax_south<br />
W<strong>at</strong>er level<br />
0.0<br />
0.00<br />
03-12 03-12 03-12 03-12 03-12 03-12 03-12 03-12 03-12 03-12 03-12 03-12 04-12 04-12 04-12 04-12 04-12 04-12 04-12 04-12 04-12 04-12 04-12 04-12 05-12<br />
00:00 02:00 04:00 06:00 08:00 10:00 12:00 14:00 16:00 18:00 20:00 22:00 00:00 02:00 04:00 06:00 08:00 10:00 12:00 14:00 16:00 18:00 20:00 22:00 00:00<br />
Time (UCT, add 1 hour to get Danish Winter Time)<br />
Report no.: D-160949<br />
Tech-wise A/S is an intern<strong>at</strong>ional consulting Tech-wise A/S<br />
engineering company specialised Kraftværksvej 53<br />
in energy and environment DK-7000 Fredericia<br />
300<br />
250<br />
200<br />
150<br />
100<br />
50<br />
0<br />
-50<br />
1.00<br />
0.90<br />
0.80<br />
0.70<br />
0.60<br />
0.50<br />
0.40<br />
0.30<br />
0.20<br />
0.10<br />
WL (cm)<br />
Current speed (m/s)
energy. environment. knowledge. Page 67 of 69<br />
8. Uncertainties<br />
Offshore wind <strong>resources</strong> can be estim<strong>at</strong>ed without using on-site d<strong>at</strong>a, but are in th<strong>at</strong> case<br />
subject to considerable uncertainty. Use of on-site d<strong>at</strong>a is always preferable, but using<br />
short time series is also a source of uncertainty since wind speeds also vary on a number<br />
of time scales from seconds to decades. Here an <strong>at</strong>tempt has been made to reduce the<br />
uncertainties in the wind resource prediction <strong>at</strong> the offshore site by using a number of<br />
different methods to establish the rel<strong>at</strong>ionship between the measured time series<br />
offshore and a reliable long-term time series <strong>at</strong> Hvide Sande. It is difficult to determine<br />
the rel<strong>at</strong>ionship between onshore and offshore wind speeds, especially when only short<br />
time series are available.<br />
The Weibull correction method relies on correct fits of the Weibull distribution to the<br />
observed wind speed d<strong>at</strong>a in each sector. The MCP method typically predicts lower<br />
wind speeds than the other method: this is most likely due to the problem of correl<strong>at</strong>ing<br />
actual wind speed values. As the distance between the measurement and prediction site<br />
increases, the probability of introducing errors into the correl<strong>at</strong>ion also increases.<br />
The wave and current d<strong>at</strong>a shown in this report are direct plot of the measured d<strong>at</strong>a, no<br />
calcul<strong>at</strong>ions and comparisons have been made, so uncertainties only depends on the<br />
uncertainty from the actual measuring instruments the Waverider and the Workhorse.<br />
Report no.: D-160949<br />
Tech-wise A/S is an intern<strong>at</strong>ional consulting Tech-wise A/S<br />
engineering company specialised Kraftværksvej 53<br />
in energy and environment DK-7000 Fredericia
energy. environment. knowledge. Page 68 of 69<br />
9. Conclusion<br />
With meteorological d<strong>at</strong>a and marine d<strong>at</strong>a recorded for a period of 3.5 years, the<br />
meteorological aspects as well as the marine aspects of the <strong>Horns</strong> <strong>Rev</strong> site, are very well<br />
documented. In addition, the d<strong>at</strong>a coverage of the meteorological measurements is more<br />
than 99%; using the back-up system it would be possible to establish a d<strong>at</strong>a set with<br />
100% coverage. The report describes the three individual meteorological systems -<br />
main, back-up and sonic system - in detail. The measuring programme investig<strong>at</strong>ed the<br />
directional sensitivity for wake effects, as well as the affect of speed-up and wake effect<br />
on mast effects.<br />
The report evalu<strong>at</strong>es the main st<strong>at</strong>istical values to give an overview of the wind records<br />
compiled from May 1999 to November 2002. The st<strong>at</strong>istics include the distribution of<br />
wind speed, wind direction and turbulence.<br />
More than 8900 hours of 20 Hz 3D-sonic measurements are available for the site. The<br />
sonic d<strong>at</strong>a are stored in a common file form<strong>at</strong> in the D<strong>at</strong>abase on <strong>Wind</strong> Characteristics.<br />
The sonic d<strong>at</strong>a shown and evalu<strong>at</strong>ed in this report are based on st<strong>at</strong>istical figures.<br />
Different methods have been applied to produce long-term predictions of the wind<br />
<strong>resources</strong>. The purpose of using different methods is th<strong>at</strong> each methodology has<br />
different strengths and weaknesses. The wind <strong>resources</strong> estim<strong>at</strong>ed in this report are<br />
compared with previous estim<strong>at</strong>es, and good agreement is seen. The report also<br />
evalu<strong>at</strong>es the <strong>at</strong>mospheric stability, the shear exponent distribution and the distribution<br />
of gusts.<br />
Wave action has been measured simultaneously with the meteorological aspects of the<br />
site; the coverage exceeds 80% for wave height d<strong>at</strong>a and 60% for current d<strong>at</strong>a. The<br />
report presents st<strong>at</strong>istical values and distribution plots. For further analysis, numerical<br />
simul<strong>at</strong>ions have been performed to establish estim<strong>at</strong>es of the long-term extremes of<br />
waves, current and w<strong>at</strong>er level.<br />
During the measuring period, the site encountered an extreme hurricane, which is also<br />
described. The hurricane hit the <strong>Horns</strong> <strong>Rev</strong> site on December 3, 1999 and exhibited<br />
extremely fierce gusts with maximum 1 Hz values of 58.5 m/s <strong>at</strong> 18.00 hours.<br />
Finally, the report discusses uncertainties rel<strong>at</strong>ed to both meteorological and marine d<strong>at</strong>a<br />
as well as d<strong>at</strong>a tre<strong>at</strong>ment.<br />
Report no.: D-160949<br />
Tech-wise A/S is an intern<strong>at</strong>ional consulting Tech-wise A/S<br />
engineering company specialised Kraftværksvej 53<br />
in energy and environment DK-7000 Fredericia
energy. environment. knowledge. Page 69 of 69<br />
10. References<br />
[1] IEC 61400-1: <strong>Wind</strong> turbine gener<strong>at</strong>or system - Part 1, Safety requirements.<br />
[2] St<strong>at</strong>istics of offshore wind speed gusts, EWEC2001, Copenhagen 2001<br />
[3] D<strong>at</strong>abase on <strong>Wind</strong> Characteristics, Internet d<strong>at</strong>abase containing wind field<br />
measurements, URL=http://www.windd<strong>at</strong>a.com/<br />
[4] Offshore <strong>Wind</strong> Resources <strong>at</strong> Selected Danish Sites, J. Højstrup, B. Lange, R. J.<br />
Barthelmie, A. M. J. Pedersen, F. A. Olsen, J. Svenson. Risø June 1997.<br />
[5] Offshore <strong>Wind</strong> Resources <strong>at</strong> Danish Measurement Sites, R. J. Barthelmie, M. S.<br />
Courtney, B. Lange, M. Nielsen, A. M. Sempreviva, J. Svenson, F. Olsen, T.<br />
Christensen. Risø November 1998.<br />
[6] Produktionsestim<strong>at</strong> baseret på korrel<strong>at</strong>ion til Hvide Sande masten (in Danish:<br />
Production estim<strong>at</strong>e based on correl<strong>at</strong>ion to the Hvide Sande mast), report<br />
no. 01-078 Søren Mogensen. Tech-wise 2001.<br />
[7] Korrel<strong>at</strong>ionsanalyse mellem Juvre og <strong>Horns</strong> <strong>Rev</strong> (in Danish: Correl<strong>at</strong>ion analysis<br />
between Juvre and <strong>Horns</strong> <strong>Rev</strong>), report no. 01-079 Søren Mogensen. Techwise<br />
2001.<br />
[8] R.J. Barthelmie, M.S. Courtney, B. Lange, M. Nielsen, A.M. Sempreviva. J. Svenson.<br />
F. Olsen, T. Christensen, 1999: Offshore <strong>Wind</strong> Resources <strong>at</strong> Danish<br />
Measurement Sites. European <strong>Wind</strong> Conference, 1- 5 March 1999, Nice,<br />
France, pp. 1101-1104.<br />
[9] Pedersen, B.M., K.S. Hansen, S. Øye, M. Brinch, O. Fabian, 1992: Some<br />
experimental investig<strong>at</strong>ions of the influence of the mounting arrangements<br />
on the accuracy of cup-anemometer measurements. Journ. Of <strong>Wind</strong>. Eng.<br />
and Ind. Aerod., vol 39, pp. 373-383.<br />
[10] J. Højstrup, 1999: Vertical Extrapol<strong>at</strong>ion of Offshore <strong>Wind</strong> Profiles. European<br />
<strong>Wind</strong> Conference, 1- 5 March 1999, Nice, France, pp. 1220-1223.<br />
[11] Dansk Hydraulisk Institut November 1999: Havvindmøllefundamenter ved <strong>Horns</strong><br />
<strong>Rev</strong>. Hydrografiske D<strong>at</strong>a (in Danish: Offshore wind farm found<strong>at</strong>ions <strong>at</strong><br />
<strong>Horns</strong> <strong>Rev</strong>. Hydrographic d<strong>at</strong>a).<br />
Report no.: D-160949<br />
Tech-wise A/S is an intern<strong>at</strong>ional consulting Tech-wise A/S<br />
engineering company specialised Kraftværksvej 53<br />
in energy and environment DK-7000 Fredericia