Wind resources at Horns Rev
Wind resources at Horns Rev
Wind resources at Horns Rev

Create successful ePaper yourself
Turn your PDF publications into a flip-book with our unique Google optimized e-Paper software.
energy. environment. knowledge. Page 38 of 69<br />
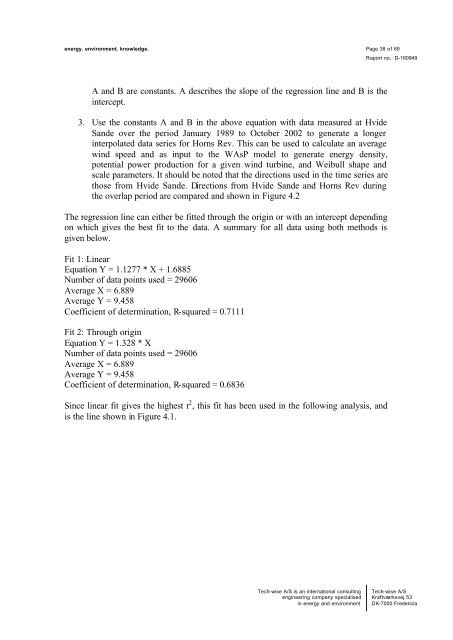
A and B are constants. A describes the slope of the regression line and B is the<br />
intercept.<br />
3. Use the constants A and B in the above equ<strong>at</strong>ion with d<strong>at</strong>a measured <strong>at</strong> Hvide<br />
Sande over the period January 1989 to October 2002 to gener<strong>at</strong>e a longer<br />
interpol<strong>at</strong>ed d<strong>at</strong>a series for <strong>Horns</strong> <strong>Rev</strong>. This can be used to calcul<strong>at</strong>e an average<br />
wind speed and as input to the WAsP model to gener<strong>at</strong>e energy density,<br />
potential power production for a given wind turbine, and Weibull shape and<br />
scale parameters. It should be noted th<strong>at</strong> the directions used in the time series are<br />
those from Hvide Sande. Directions from Hvide Sande and <strong>Horns</strong> <strong>Rev</strong> during<br />
the overlap period are compared and shown in Figure 4.2<br />
The regression line can either be fitted through the origin or with an intercept depending<br />
on which gives the best fit to the d<strong>at</strong>a. A summary for all d<strong>at</strong>a using both methods is<br />
given below.<br />
Fit 1: Linear<br />
Equ<strong>at</strong>ion Y = 1.1277 * X + 1.6885<br />
Number of d<strong>at</strong>a points used = 29606<br />
Average X = 6.889<br />
Average Y = 9.458<br />
Coefficient of determin<strong>at</strong>ion, R-squared = 0.7111<br />
Fit 2: Through origin<br />
Equ<strong>at</strong>ion Y = 1.328 * X<br />
Number of d<strong>at</strong>a points used = 29606<br />
Average X = 6.889<br />
Average Y = 9.458<br />
Coefficient of determin<strong>at</strong>ion, R-squared = 0.6836<br />
Since linear fit gives the highest r 2 , this fit has been used in the following analysis, and<br />
is the line shown in Figure 4.1.<br />
Report no.: D-160949<br />
Tech-wise A/S is an intern<strong>at</strong>ional consulting Tech-wise A/S<br />
engineering company specialised Kraftværksvej 53<br />
in energy and environment DK-7000 Fredericia