GIS-based Environmental Sensitivity Index (ESI) mapping for oil ...
GIS-based Environmental Sensitivity Index (ESI) mapping for oil ...
GIS-based Environmental Sensitivity Index (ESI) mapping for oil ...
- No tags were found...

You also want an ePaper? Increase the reach of your titles
YUMPU automatically turns print PDFs into web optimized ePapers that Google loves.
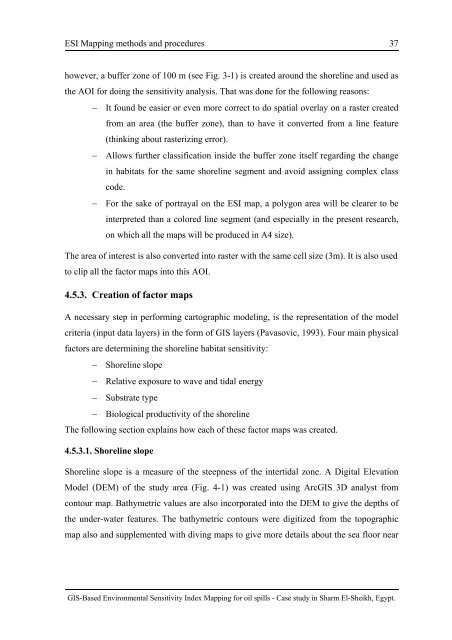
<strong>ESI</strong> Mapping methods and procedures 37however, a buffer zone of 100 m (see Fig. 3-1) is created around the shoreline and used asthe AOI <strong>for</strong> doing the sensitivity analysis. That was done <strong>for</strong> the following reasons:− It found be easier or even more correct to do spatial overlay on a raster createdfrom an area (the buffer zone), than to have it converted from a line feature(thinking about rasterizing error).− Allows further classification inside the buffer zone itself regarding the changein habitats <strong>for</strong> the same shoreline segment and avoid assigning complex classcode.− For the sake of portrayal on the <strong>ESI</strong> map, a polygon area will be clearer to beinterpreted than a colored line segment (and especially in the present research,on which all the maps will be produced in A4 size).The area of interest is also converted into raster with the same cell size (3m). It is also usedto clip all the factor maps into this AOI.4.5.3. Creation of factor mapsA necessary step in per<strong>for</strong>ming cartographic modeling, is the representation of the modelcriteria (input data layers) in the <strong>for</strong>m of <strong>GIS</strong> layers (Pavasovic, 1993). Four main physicalfactors are determining the shoreline habitat sensitivity:− Shoreline slope− Relative exposure to wave and tidal energy− Substrate type− Biological productivity of the shorelineThe following section explains how each of these factor maps was created.4.5.3.1. Shoreline slopeShoreline slope is a measure of the steepness of the intertidal zone. A Digital ElevationModel (DEM) of the study area (Fig. 4-1) was created using Arc<strong>GIS</strong> 3D analyst fromcontour map. Bathymetric values are also incorporated into the DEM to give the depths ofthe under-water features. The bathymetric contours were digitized from the topographicmap also and supplemented with diving maps to give more details about the sea floor near<strong>GIS</strong>-Based <strong>Environmental</strong> <strong>Sensitivity</strong> <strong>Index</strong> Mapping <strong>for</strong> <strong>oil</strong> spills - Case study in Sharm El-Sheikh, Egypt.