GIS-based Environmental Sensitivity Index (ESI) mapping for oil ...
GIS-based Environmental Sensitivity Index (ESI) mapping for oil ...
GIS-based Environmental Sensitivity Index (ESI) mapping for oil ...
- No tags were found...

You also want an ePaper? Increase the reach of your titles
YUMPU automatically turns print PDFs into web optimized ePapers that Google loves.
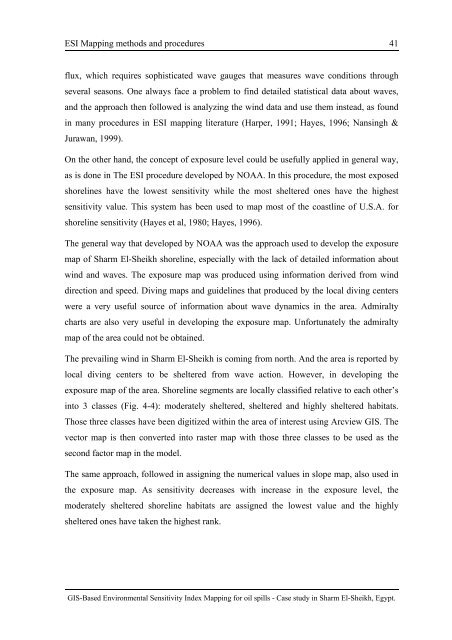
<strong>ESI</strong> Mapping methods and procedures 41flux, which requires sophisticated wave gauges that measures wave conditions throughseveral seasons. One always face a problem to find detailed statistical data about waves,and the approach then followed is analyzing the wind data and use them instead, as foundin many procedures in <strong>ESI</strong> <strong>mapping</strong> literature (Harper, 1991; Hayes, 1996; Nansingh &Jurawan, 1999).On the other hand, the concept of exposure level could be usefully applied in general way,as is done in The <strong>ESI</strong> procedure developed by NOAA. In this procedure, the most exposedshorelines have the lowest sensitivity while the most sheltered ones have the highestsensitivity value. This system has been used to map most of the coastline of U.S.A. <strong>for</strong>shoreline sensitivity (Hayes et al, 1980; Hayes, 1996).The general way that developed by NOAA was the approach used to develop the exposuremap of Sharm El-Sheikh shoreline, especially with the lack of detailed in<strong>for</strong>mation aboutwind and waves. The exposure map was produced using in<strong>for</strong>mation derived from winddirection and speed. Diving maps and guidelines that produced by the local diving centerswere a very useful source of in<strong>for</strong>mation about wave dynamics in the area. Admiraltycharts are also very useful in developing the exposure map. Un<strong>for</strong>tunately the admiraltymap of the area could not be obtained.The prevailing wind in Sharm El-Sheikh is coming from north. And the area is reported bylocal diving centers to be sheltered from wave action. However, in developing theexposure map of the area. Shoreline segments are locally classified relative to each other’sinto 3 classes (Fig. 4-4): moderately sheltered, sheltered and highly sheltered habitats.Those three classes have been digitized within the area of interest using Arcview <strong>GIS</strong>. Thevector map is then converted into raster map with those three classes to be used as thesecond factor map in the model.The same approach, followed in assigning the numerical values in slope map, also used inthe exposure map. As sensitivity decreases with increase in the exposure level, themoderately sheltered shoreline habitats are assigned the lowest value and the highlysheltered ones have taken the highest rank.<strong>GIS</strong>-Based <strong>Environmental</strong> <strong>Sensitivity</strong> <strong>Index</strong> Mapping <strong>for</strong> <strong>oil</strong> spills - Case study in Sharm El-Sheikh, Egypt.