The Electro Sense
The Electro Sense
The Electro Sense
- No tags were found...

Create successful ePaper yourself
Turn your PDF publications into a flip-book with our unique Google optimized e-Paper software.
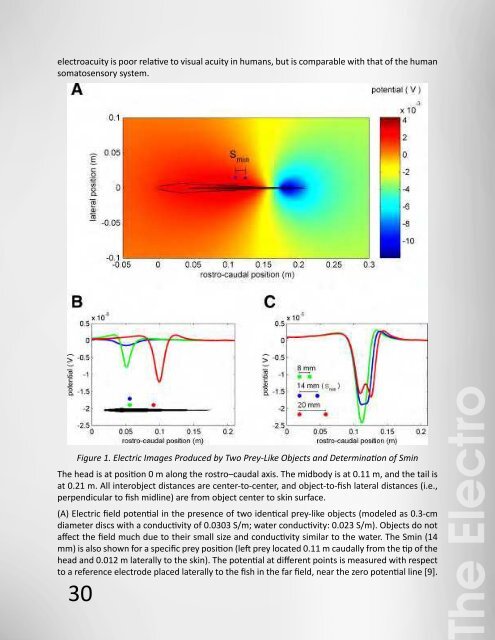
electroacuity is poor relative to visual acuity in humans, but is comparable with that of the humansomatosensory system.(B) Overlays of electric images for three different object locations illustrating the increase in imageamplitude in the caudal direction (x) and the decrease in amplitude for increasing lateral distances(y). (x,y) = (0.05, 0.03), (0.05, 0.015), (0.1, 0.015) m. As described in Materials and Methods, theseimages are computed as the difference between the transdermal potentials measured with andwithout the object present.(C) Overlays of electric images for three distinct interprey distances (see inset). Blue trace showsSmin, when the two peaks in the electric image are just noticeable. Computation of the images isas in (B). Location of more-rostral prey as in (A). doi:10.1371/journal.pcbi.0030038.g001Despite the apparent low quality of electrosensory signals, weakly electric fish are able to detectsmall prey [7,17]. Although there is no direct evidence, it is reasonable to assume that they do soeven in the presence of noisy background signals [7]. In a related task (object tracking), backgroundnoise has been shown to degrade performance [22,23]. Single-cell recordings in midbrain neuronshave further revealed that some low-frequency background signals can interfere with directionalselectivity [24]. It is thus believed that some of the natural behaviors exhibited by the fish play acentral role in signal extraction. In particular, simulations have suggested that tail-bending couldimprove object detection by increasing the electric image’s amplitude [13,14].It has also been suggested that the back-and-forth swimming, or scanning motion, observed inthese fish could be used to generate specific electrolocation cues [25–28], although this has notyet been demonstrated. Indeed, to elucidate the nature of these motion-related cues, we havesimulated this scanning motion and show that, under some conditions, this behavior could assistin extracting small prey-like signals from large background ones. We show that the component ofthe electric image produced by a sufficiently dense background does not change during scanning,whereas the one produced by the prey object, albeit miniscule in comparison, does. This processis similar to motion-related cues and active sensing techniques seen in other contexts [28,29].Figure 1. Electric Images Produced by Two Prey-Like Objects and Determination of Smin<strong>The</strong> head is at position 0 m along the rostro–caudal axis. <strong>The</strong> midbody is at 0.11 m, and the tail isat 0.21 m. All interobject distances are center-to-center, and object-to-fish lateral distances (i.e.,perpendicular to fish midline) are from object center to skin surface.(A) Electric field potential in the presence of two identical prey-like objects (modeled as 0.3-cmdiameter discs with a conductivity of 0.0303 S/m; water conductivity: 0.023 S/m). Objects do notaffect the field much due to their small size and conductivity similar to the water. <strong>The</strong> Smin (14mm) is also shown for a specific prey position (left prey located 0.11 m caudally from the tip of thehead and 0.012 m laterally to the skin). <strong>The</strong> potential at different points is measured with respectto a reference electrode placed laterally to the fish in the far field, near the zero potential line [9].<strong>The</strong> <strong>Electro</strong><strong>Sense</strong>30 31ResultsIn the following analyses, we use our previously described finite-element model of the electricfield produced by A. leptorhynchus (see Materials and Methods and [9,30]).Figure 1A shows thesimulated dipole-like potential map for this fish in the presence of two prey-like objects. Suchobjects do not greatly perturb the fish’s natural field due to their small size and conductivity (whichis similar to that of the water). Figure 1B shows overlays of electric images due to single objectsat different locations (i.e., each image is computed separately). Such images show characteristicshapes but vary systematically in amplitude and width with rostral–caudal and lateral location[5,9,10]. Figure 1C shows images produced by object pairs for three different interobject distances(shown in inset). Prey-like objects that are located too close together (green trace) produce asingle peak in the electric image (similar to the images in Figure 1B), while objects separated by alarger distance produce two distinct peaks (red trace). <strong>The</strong> blue trace illustrates the electric imagein which two peaks are just barely distinguishable; we define the associated interobject distanceas Smin. Thus, Smin, measured in these noiseless conditions, delineates a limit to electroacuity.A smaller Smin suggests better electroacuity (i.e., increased spatial resolution). For this specificprey-like object and rostro–caudal location, the Smin is 14 mm. This suggests that, at this lateraldistance, these two objects must be separated by at least 14 mm, a distance approximately fivetimes their diameter, to be distinguished.