The Electro Sense
The Electro Sense
The Electro Sense
- No tags were found...

Create successful ePaper yourself
Turn your PDF publications into a flip-book with our unique Google optimized e-Paper software.
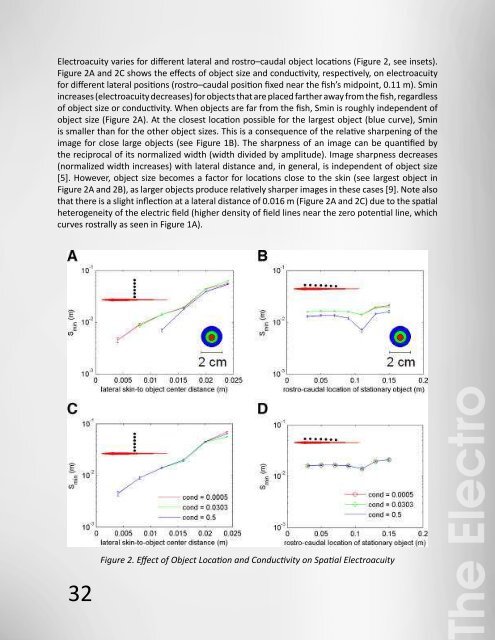
<strong>Electro</strong>acuity varies for different lateral and rostro–caudal object locations (Figure 2, see insets).Figure 2A and 2C shows the effects of object size and conductivity, respectively, on electroacuityfor different lateral positions (rostro–caudal position fixed near the fish’s midpoint, 0.11 m). Sminincreases (electroacuity decreases) for objects that are placed farther away from the fish, regardlessof object size or conductivity. When objects are far from the fish, Smin is roughly independent ofobject size (Figure 2A). At the closest location possible for the largest object (blue curve), Sminis smaller than for the other object sizes. This is a consequence of the relative sharpening of theimage for close large objects (see Figure 1B). <strong>The</strong> sharpness of an image can be quantified bythe reciprocal of its normalized width (width divided by amplitude). Image sharpness decreases(normalized width increases) with lateral distance and, in general, is independent of object size[5]. However, object size becomes a factor for locations close to the skin (see largest object inFigure 2A and 2B), as larger objects produce relatively sharper images in these cases [9]. Note alsothat there is a slight inflection at a lateral distance of 0.016 m (Figure 2A and 2C) due to the spatialheterogeneity of the electric field (higher density of field lines near the zero potential line, whichcurves rostrally as seen in Figure 1A).Figure 2. Effect of Object Location and Conductivity on Spatial <strong>Electro</strong>acuity<strong>The</strong> <strong>Electro</strong><strong>Sense</strong>In all panels, see fish insets for approximate lateral and rostro–caudal locations where Smin wascalculated. Error bars represent the sampling that was used to calculate the Smin (either 0.5 or 1mm). Lateral distance is measured as object center to fish skin (as in Figure 1).(A) Effect of lateral distance on Smin for three distinct object diameters (rostro–caudal location,x = 0.11 m). Red, 0.3 cm (prey size); green, 1 cm; blue, 2 cm. Object conductivity fixed at 0.0303S/m (prey conductivity).(B) Effect of rostro–caudal position on Smin for same object sizes and conductivity as (A), with alateral distance of 0.012 m.(C) Effect of lateral distance on Smin for three distinct object conductivities (rostro–caudal location,x = 0.11m). Red, 0.0005 S/m (plant conductivity); green, 0.0303 S/m (prey conductivity); blue, 0.5S/m. Object diameters fixed at 0.3 cm (prey size).(D) Effect of rostro–caudal position on Smin for same object diameter and conductivities as in (C),with a lateral distance of 0.012 m.doi:10.1371/journal.pcbi.0030038.g002Figure 2B and 2D shows the effects of object size and conductivity, respectively, on electroacuityfor different rostro–caudal positions (lateral object center-to-skin distance fixed at 0.012 m). Ingeneral, Smin is smaller for larger objects, all along the length of the fish. <strong>The</strong> largest objects (2cm) can actually be distinguished in the artificial condition of overlapping (i.e., the two objectsare fused into a single composite peanut-shaped object), suggesting a mechanism for shapediscrimination under some conditions. <strong>The</strong> position x = 0.11 m suggests a point of optimal acuityalong the side of the fish. <strong>The</strong> two peaks in the image can be distinguished more easily for objectsin this region because this is the rostro–caudal location where electric images are sharpest [9,10],so that there is minimal interaction between the individual images produced by each object.Object conductivity has comparatively little effect on the Smin in both lateral and rostro–caudaldirections (Figure 2C and 2D). Overall, Smin varies much more in the lateral direction than in therostro–caudal direction (compare Figure 2A–2C and 2B–2D) due to the relatively large changes inimage sharpness as lateral object distance increases [5,8].<strong>The</strong> effect of water conductivity on electroacuity was also studied for a specific location (x =0.11 m, y = 0.015 m). For the range of water conductivity values found in the rivers in which A.leptorhynchus live (between 0.00085 and 0.01135 S/m [2]), Smin changes only slightly. As anoverall trend, Smin decreased as water conductivity diminished (from 15.5 to 12.5 mm as waterconductivity decreased from 0.05 to 0.0005 S/m).As a first step toward understanding electroacuity in a more natural context, the electric imagesproduced by differently sized arrays of background objects (with “plant-like” conductivity) werestudied systematically. In Figure 3A, the red trace shows the electric image produced by a singlesuch object located 0.11 m caudally from the tip of the fish’s head (red object in inset located closeto the fish’s midpoint). <strong>The</strong> orange trace shows the electric image produced by three objects: thecentral one (red) plus one (orange) added 0.03 m on each side. In a similar progression, electricimages are shown for up to 11 objects. With larger numbers of aligned objects, the electric imagesconverge. Thus, for an array of seven objects (approximately a fish body length), the image isalmost the same as with 11 objects. <strong>The</strong> electric images are each marked by a singular peakbecause the interobject distance is too small (at this lateral distance of 0.05 m) to resolve different32 33