Foresight Vehicle Technology Roadmap - Institute for Manufacturing
Foresight Vehicle Technology Roadmap - Institute for Manufacturing
Foresight Vehicle Technology Roadmap - Institute for Manufacturing
- No tags were found...

You also want an ePaper? Increase the reach of your titles
YUMPU automatically turns print PDFs into web optimized ePapers that Google loves.
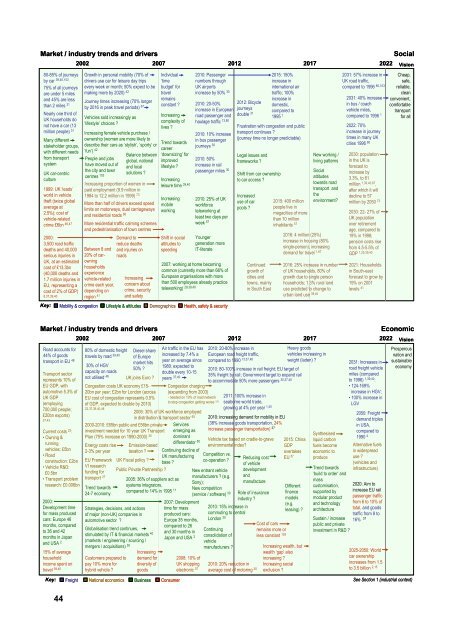
Market / industry trends and driversSocial2002 2007 2012 2017 2022 Vision80-85% of journeysby car 39,40,10375% of all journeysGrowth in personal mobility (70% ofdrivers use car <strong>for</strong> leisure day tripsevery week or month; 50% expect to beIndividual‘timebudget’ <strong>for</strong>2010: Passengernumbers throughUK airportsare under 5 milesmaking more by 2020) 42travelincrease by 50% 30and 45% are lessremainsJourney times increasing (70% longerthan 2 miles 31by 2016 in peak travel periods) 67 constant ? 2010: 20-50%increase in EuropeanNearly one third of<strong>Vehicle</strong>s sold increasingly asIncreasing road passenger andUK households do‘lifestyle’ choices ?complexity of haulage traffic 13,80not have a car (13lives ?million people) 31Increasing female vehicle purchase /2010: 10% increaseMany differentownership (women are more likely todescribe their cars as ‘stylish’, ‘sporty’ orTrend towardsin bus passengerstakeholder groups,‘fun’) 42careerjourneys 30with different needsBalance between‘downsizing’ <strong>for</strong>from transportPeople and jobsglobal, nationalimproved2010: 50%systemhave moved out ofand locallifestyle ?increase in railthe city and townpassenger miles UK car-centricsolutions ?30centres cultureIncreasingIncreasing proportion of women inleisure time 39,401999: UK ‘leads’paid employment (9.9 million inworld in vehicle1984 to 12.2 million in 1999) 73theft (twice globalIncreasing2010: 25% of UKMore than half of drivers exceed speedaverage atmobilework<strong>for</strong>celimits on motorways, dual carriageways2.5%); cost ofworkingteleworking atand residential roads 66vehicle-relatedleast two days percrime £6bn 46,47More residential traffic calming schemesweek 57and pedestrianisation of town centres2000:3,500 road trafficdeaths and 40,000serious injuries inBetween 8 and20% of car-Demand toreduce deathsand injuries onroadsShift in socialattitudes tospeedingYoungergeneration moreIT-literateUK, at an estimatedowning2007: working at home becomingcost of £13.3bnhouseholds(40,000 deaths andexperiencecommon (currently more than 66% ofIncreasing European organisations with more1.7 million injuries in vehicle-relatedEU, representing aconcern about than 500 employees already practicecrime each year,cost of 2% of GDP)crime, security teleworking)depending on28,39,408,37,39,40region 41and safetyKey:Mobility & congestion Lifestyle & attitudes DemographicsHealth, safety & security2012: Bicyclejourneysdouble 31Frustration with congestion and publictransport continues ?(journey time no longer predictable)Legal issues andframeworks ?Shift from car ownershipto car access ?Increaseduse of carpools ?2015: 150%2031: 57% increase inincrease inUK road traffic,international aircompared to 1996 80,103traffic; 100%increase in2031: 40% increasedomestic,in bus / coachcompared tovehicle miles,1995 1 compared to 1996 12015: 400 millionpeople live inmegacities of morethan 10 millioninhabitants 572016: 4 million (25%)increase in housing (80%single-person), increasingdemand <strong>for</strong> travel 1,67Continued2016: 25% increase in numbergrowth ofof UK households, 80% ofcities andgrowth due to single persontowns, mainlyhouseholds; 1.3% rural landin South Eastuse predicted to change tourban land use 39,402022: 70%increase in journeytimes in many UKcities 1996 80New working /2030: populationliving patternsin the UK is<strong>for</strong>ecast toSocialincrease byattitudes3.3%, to 61towards roadmillion 1,39,40,67 ,transport andafter which it willthedecline to 57environment?million by 2050 732030: 22- 27% ofUK populationover retirementage, compared to19% in 1998;pension costs risefrom 4.5-5.5% ofGDP 1,25,39,402021: Householdsin South-east<strong>for</strong>ecast to grow by19% on 2001levels 41Cheap,safe,reliable,cleanconvenient,com<strong>for</strong>tabletransport<strong>for</strong> allMarket / industry trends and driversEconomic2002 2007 2012 2017 2022 VisionRoad accounts <strong>for</strong>44% of goodstransport in EU 48Transport sectorrepresents 10% ofEU GDP, withautomotive 5.3% ofUK GDP(employing700,000 people;£20bn exports)37,43Current costs 22 :•Owning &runningvehicles: £5bn• Roadconstruction: £2bn• <strong>Vehicle</strong> R&D:£0.5bn• Transport problemresearch: £0.006bn2000:Development time<strong>for</strong> mass producedcars: Europe 46months, comparedto 36 and 42months in Japanand USA 215% of averagehouseholdincome spent ontravel 39,404480% of domestic freightDiesel shareAir traffic in the EU has 2010: 20-80% increase inHeavy goodsProsperoustravels by road 39,40of Europeincreased by 7.4% a European road freight traffic,vehicles increasing innation andmarket hitsyear on average since compared to 1990 13,37,48weight (laden) ?2031: Increases insustainable30% of HGV50% ?1980; expected to2010: 80-100% increase in rail freight; EU target ofroad freight vehicleeconomycapacity on roadsdouble every 10-1535% freight by rail; Government target to expand railmiles (comparednot utilised 49 UK joins Euro ? years 37,40to accommodate 50% more passengers 30,37,40to 1996) 1,39,40 :Congestion costs UK economy £15-Congestion charging• 124-169%20bn per year; £2bn <strong>for</strong> London (across(expanding from 2003)increase in HGV;EU cost of congestion represents 0.5%- needed on 10% of road network2011: 100% increase in• 100% increase into stop congestion getting worse of GDP, expected to double by 2010)103seaborne world trade,LGV22,37,39,40,48growing at 4% per year 1,402006: 30% of UK work<strong>for</strong>ce employed2050: Freightin distribution & transport sector 652010: increasing demand <strong>for</strong> mobility in EUdemand triples2000-2010: £65bn public and £56bn privateServices(38% increase goods transportation, 24%in USA,investment needed <strong>for</strong> 10 year UK Transportemerging asincrease passenger transportation) 37compared toSynthesisedPlan (75% increase on 1990-2000) 30dominant<strong>Vehicle</strong> tax based on cradle-to-grave1990 liquid carbon4differentiatorEnergy costs rise502015: ChinaEmission-basedenvironmental index?GDPfuels becomeAlternative fuels2-3% per yeartaxation ?Continuing decline ofovertakeseconomic toin widespreadUK manufacturingCompetition vs.produceuse ?EU Framework UK Fiscal policy ?Reducing cost EUbase ?co-operation ?57VI researchof vehicle(vehicles andNew entrant vehiclefunding <strong>for</strong>Public Private Partnership ?developmentTrend towards infrastructure)transport 37manufacturers ? (e.g. and‘build to order’ and2005: 36% of suppliers act asSony);manufacturemasssystems integrators,Trend towardsNew competitionDifferent customisation, 2020: Aim tocompared to 14% in 1995 24-7 economy11(service / software) 50financeincrease EU railRole of insurancesupported bymodelspassenger trafficindustry ?modular product2007: Development(e.g.and technologyfrom 6 to 10% ofStrategies, decisions, and actionstime <strong>for</strong> mass2010: 15% increase inleasing) ?architecturetotal, and goodsof major (non-UK) companies inproduced cars:commuting to centraltraffic from 8 toautomotive sector ?Europe 35 months,London 30Sustain / increase16% 37compared to 26Cost of carspublic and privateGlobalisation trend continues,Continuinginvestment in R&D ?and 30 months inremains more orstimulated by IT & financial markets 40Japan and USA consolidation of2less constant 103(markets / engineering / sourcing /vehiclemergers / acquisitions) 50manufacturers ?Increasing wealth, butIncreasingwealth ‘gap’ also2025-2050: WorldCustomers prepared todemand <strong>for</strong>2008: 10% ofincreasing ?car ownershippay 10% more <strong>for</strong>diversity ofUK shopping2010: 20% reduction inIncreasing socialincreases from 1.5hybrid vehicle ?goodselectronic 37average cost of motoring 30exclusion ?to 3.5 billion 2,15Key: Freight National economics BusinessConsumerSee Section 1 (industrial context)