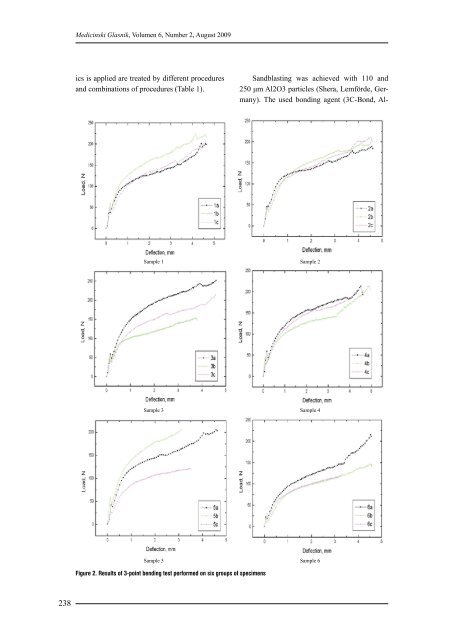
238 Medicinski Glasnik, Volumen 6, Number 2, August 2009 ics is applied are treated by different procedures and combinati<strong>on</strong>s <str<strong>on</strong>g>of</str<strong>on</strong>g> procedures (Table 1). Sandblasting was achieved with 110 and 250 μm Al2O3 particles (Shera, Lemförde, Germany). The used b<strong>on</strong>ding agent (3C-B<strong>on</strong>d, Al- Sample 1 Sample 2 Sample 3 Sample 4 Sample 5 Sample 6 Figure 2. Results <str<strong>on</strong>g>of</str<strong>on</strong>g> 3-point bending test performed <strong>on</strong> six groups <str<strong>on</strong>g>of</str<strong>on</strong>g> specimens
phadent N.V., Antwerpen, Belgium) is applied to the samples in group 5. The samples <str<strong>on</strong>g>of</str<strong>on</strong>g> group 6 are kept in the soluti<strong>on</strong> obtained by mixing 50 ml <str<strong>on</strong>g>of</str<strong>on</strong>g> distilled water and 50 ml <str<strong>on</strong>g>of</str<strong>on</strong>g> 32% hydrochloric acid for 30 minutes. After etching these samples are first <str<strong>on</strong>g>of</str<strong>on</strong>g> all washed in distilled water, and then in the compound <str<strong>on</strong>g>of</str<strong>on</strong>g> ethyl alcohol and acet<strong>on</strong>e in ratio 1:1. Figure 1 shows the characteristic <str<strong>on</strong>g>surface</str<strong>on</strong>g> <str<strong>on</strong>g>of</str<strong>on</strong>g> the sample prepared in this way recorded by a scanning electr<strong>on</strong>ic microscope (Tescan Vega TS5136LS, Tescan, Brno, Czech R) with the sec<strong>on</strong>dary electr<strong>on</strong> detector (SE). Al<strong>on</strong>g the middle <str<strong>on</strong>g>of</str<strong>on</strong>g> thus prepared <strong>metal</strong> plates the <strong>ceramic</strong>s (Duceram Kiss, DeguDent, Hanau-Wolfgang, Germany) is fired (<strong>ceramic</strong> furnace Focus 2006, Shenpaz, Tel Aviv, Israel) in the length <str<strong>on</strong>g>of</str<strong>on</strong>g> 8 mm, width <str<strong>on</strong>g>of</str<strong>on</strong>g> 3 mm, and thickness <str<strong>on</strong>g>of</str<strong>on</strong>g> 1 mm. The <strong>ceramic</strong>s corresp<strong>on</strong>ds to the manufacturer’s instructi<strong>on</strong>s and bel<strong>on</strong>gs to the group <str<strong>on</strong>g>of</str<strong>on</strong>g> <strong>ceramic</strong>s with the fired temperature <str<strong>on</strong>g>of</str<strong>on</strong>g> up to 980°C, suitable for coating <str<strong>on</strong>g>of</str<strong>on</strong>g> the menti<strong>on</strong>ed alloy. The samples are tested by bending in three points <strong>on</strong> the tester machine (LRX Lloyd Instruments, Fareham, Great Britain) with installed Nexygen programme for the <str<strong>on</strong>g>process</str<strong>on</strong>g>ing <str<strong>on</strong>g>of</str<strong>on</strong>g> results. The samples are set so that the <str<strong>on</strong>g>surface</str<strong>on</strong>g> with <strong>ceramic</strong>s is turned opposite to the pin, and the <strong>metal</strong> part resting <strong>on</strong> the supports at a distance <str<strong>on</strong>g>of</str<strong>on</strong>g> 20 mm, and the diameter <str<strong>on</strong>g>of</str<strong>on</strong>g> pin that loads the sample is 1 mm. The shift <str<strong>on</strong>g>of</str<strong>on</strong>g> pin is c<strong>on</strong>stant during testing at a speed <str<strong>on</strong>g>of</str<strong>on</strong>g> 1.5 mm/min, and the testing c<strong>on</strong>tinues Figure 3. Typical areas during three-point bending test Mehulić et al Surface <str<strong>on</strong>g>finishing</str<strong>on</strong>g> and b<strong>on</strong>d strength until the fracture, i.e. to full separati<strong>on</strong> <str<strong>on</strong>g>of</str<strong>on</strong>g> the <strong>ceramic</strong>s from the <strong>metal</strong>. Testing procedure has been carried out according to the guidelines given in ISO 9693 (15). After testing the samples type <str<strong>on</strong>g>of</str<strong>on</strong>g> fracture <str<strong>on</strong>g>surface</str<strong>on</strong>g>s (cohesive, adhesive or cohesive-adhesive) were examined by scanning electr<strong>on</strong>ic microscope (Tescan Vega TS5136LS, Tescan, Brno, Czech R). The same pers<strong>on</strong> has performed all the tests. The multiple range tests, Fischer’s LSD test and ANOVA have been used for statistic analysis. RESULTS The results <str<strong>on</strong>g>of</str<strong>on</strong>g> 3-point bending test performed <strong>on</strong> 6 groups <str<strong>on</strong>g>of</str<strong>on</strong>g> specimens, (each group has three specimens) are presented in Figure 2. The diagrams obtained by testing <strong>on</strong> the tester and presented in Figure 2 show the same trend, i.e. the behaviour <str<strong>on</strong>g>of</str<strong>on</strong>g> all samples during testing is inter-compatible. Therefore, Figure 3 can generally explain the behaviour <str<strong>on</strong>g>of</str<strong>on</strong>g> all <strong>metal</strong>-<strong>ceramic</strong> systems in a three-point flexure b<strong>on</strong>d test. According to Figure 3 it is possible to define three characteristic areas during testing. The beginning <str<strong>on</strong>g>of</str<strong>on</strong>g> testing where the force-deflecti<strong>on</strong> diagram is a horiz<strong>on</strong>tal line, i.e. the pin is lowered without increase <str<strong>on</strong>g>of</str<strong>on</strong>g> force, represents the first area. Such behaviour is caused by preparati<strong>on</strong> <str<strong>on</strong>g>of</str<strong>on</strong>g> testing and represents the period from beginning <str<strong>on</strong>g>of</str<strong>on</strong>g> testing to the moment <str<strong>on</strong>g>of</str<strong>on</strong>g> achieving the predefined pre-load. Point A (Figure 3), where a sudden increase in force is noticed, represents the moment <str<strong>on</strong>g>of</str<strong>on</strong>g> c<strong>on</strong>tact between the pin and the sample and the actual beginning <str<strong>on</strong>g>of</str<strong>on</strong>g> the testing area 2. The linear part <str<strong>on</strong>g>of</str<strong>on</strong>g> the diagram that follows from this point represents comm<strong>on</strong> resistance to flexing <str<strong>on</strong>g>of</str<strong>on</strong>g> the <strong>metal</strong>-<strong>ceramic</strong> sample, since in this area the b<strong>on</strong>d between <strong>metal</strong> and <strong>ceramic</strong>s is still str<strong>on</strong>g. Point B (Figure 3) represents the start <str<strong>on</strong>g>of</str<strong>on</strong>g> the third area, i.e. the moment <str<strong>on</strong>g>of</str<strong>on</strong>g> loosening <str<strong>on</strong>g>of</str<strong>on</strong>g> the b<strong>on</strong>d between <strong>metal</strong> and <strong>ceramic</strong>s and the moment at 239