Getting Started - (DDS) Community RTI Connext Users
Getting Started - (DDS) Community RTI Connext Users
Getting Started - (DDS) Community RTI Connext Users
- No tags were found...

You also want an ePaper? Increase the reach of your titles
YUMPU automatically turns print PDFs into web optimized ePapers that Google loves.
Contents1 Introduction ............................................................................................................ 1-11.1 Available Documentation..........................................................................................................1-31.2 Reading Guide ............................................................................................................................1-31.3 How to Get Support...................................................................................................................1-42 Installation .............................................................................................................. 2-12.1 Before Installation.......................................................................................................................2-12.2 Installing Wireshark on Windows Systems ............................................................................2-12.3 Installing Wireshark on Linux Systems...................................................................................2-22.4 Installing Wireshark on Solaris Systems .................................................................................2-22.5 Uninstalling Wireshark..............................................................................................................2-23 Starting Wireshark................................................................................................. 3-14 Capturing RTPS Packets ...................................................................................... 4-15 Analyzing RTPS Packets ...................................................................................... 5-15.1 RTPS Submessage Types ...........................................................................................................5-25.2 Displaying Packets .....................................................................................................................5-25.2.1 Using a Display Filter....................................................................................................5-45.2.2 Color-Coding Packets .................................................................................................5-105.3 Analyzing Packets from <strong>RTI</strong> Data Distribution Service Applications..............................5-115.3.1 Analyzing the User Data Sample Trace....................................................................5-125.3.2 Analyzing the Discovery Data Sample Trace ..........................................................5-16iii
6 Practical Uses with <strong>RTI</strong> Applications................................................................ 6-16.1 Debugging Discovery Problems.............................................................................................. 6-16.2 Visualizing Your System........................................................................................................... 6-36.3 Providing Information to <strong>RTI</strong> Support................................................................................... 6-5iv
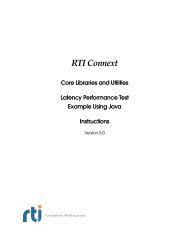
1. IntroductionChapter 1IntroductionWireshark is a network-packet analyzer that supports many network protocols, includingReal-Time Publish-Subscribe (RTPS), the wire protocol used by <strong>RTI</strong>® Data DistributionService middleware.Wireshark can be used to capture and analyze RTPS packets from <strong>RTI</strong> Data DistributionService 4.x applications. It supports RTPS 2.1 (and lower) and is specifically tailored tomake RTPS packet analysis easier by including:❏ A set of predefined filters to quickly select different groups of packets from theRTPS protocol.❏ A column in the Packet List that shows the GUID Prefix for each RTPS packet.(This value uniquely identifies a DomainParticipant within a Domain.)❏ Coloring rules that highlight important RTPS packets. Packets not strictly relatedto <strong>RTI</strong> Data Distribution Service traffic are grayed-out.Network packet and traffic analyzers are used during application development and distributedsystem configuration to monitor the packets over the network. You can use filtersto capture specific types of packets, then analyze the captured packets.This manual will help you use Wireshark to analyze RTPS packets. This analysis willgive you information on two levels:❏ A high-level look at the RTPS submessages that are flowing between your <strong>RTI</strong><strong>RTI</strong> Data Distribution Service applications.❏ A detailed look at the contents of individual packets.Wireshark’s main window makes it easy to see both views. Figure 1.1 shows the mainwindow and points out some important features.1-1
Chapter 1Figure 1.1Wireshark’s Main WindowGUID Prefix Column — only availablein <strong>RTI</strong>’s distribution of WiresharkBytes Packet Details Packet ListPacketsequencewithautomaticcolorcoding ofRTPSpacketsRTPSHeaderDatasubmessageRaw dataThe Packet List pane on top lists the sequence of captured submessages. The middle pane shows a decoded viewof a selected packet. The bottom pane shows the raw data for any selected field in a packet. You can customizethese views from the View menu. To change which columns are displayed, select Edit, Preferences, UserInterface, Columns.1-2
1.1 Available Documentation1.1 Available Documentation1. Introduction❏ <strong>RTI</strong> Wireshark Release Notes. Please see <strong>RTI</strong>_Wireshark_ReleaseNotes.pdf forsystem requirements, installation instructions, and other important information.❏ <strong>RTI</strong> Data Distribution Service User’s Manual. This document provides details onthe <strong>RTI</strong> Data Distribution Service API and describes how RTPS packets are usedby <strong>RTI</strong> Data Distribution Service-based applications. In particular, you shouldreview the Discovery chapter. Open /doc/pdf/<strong>RTI</strong>_<strong>DDS</strong>_<strong>Users</strong>Manual.pdf, where is where you installed <strong>RTI</strong>Data Distribution Service.❏ RTPS Specification. Please see http://www.omg.org/spec/<strong>DDS</strong>I/2.1/.❏ Wireshark online help. There is extensive online help included with Wireshark.Select Help, Contents from the menubar for a detailed user’s guide in HTMLformat.❏ Wireshark User’s Guide. This PDF document describes how to use Wireshark’s features.It is not included in the installation, but can be downloaded from Wireshark’swebsite (www.wireshark.org/docs). Note that it may pertain to a slightlydifferent version of Wireshark.1.2 Reading GuideWe suggest that you read the documentation in the following order:❏ Read this chapter to become familiar with the system requirements.❏ Read the <strong>RTI</strong> Wireshark Release Notes.❏ Follow the steps in Chapter 2: Installation.❏ Read Chapter 4: Capturing RTPS Packets for a quick overview of how to captureRTPS packets.❏ Read Chapter 5: Analyzing RTPS Packets to learn how to analyze each type ofRTPS packet by looking at sample files of captured RTPS packets. During thisprocess, you will need to reference the Real-Time Publish-Subscribe Wire ProtocolSpecification.❏ Read Chapter 6: Practical Uses with <strong>RTI</strong> Applications for ideas on how to useWireshark during <strong>RTI</strong> Data Distribution Service application development.1-3
Chapter 1❏ Consult the Wireshark online help and user’s guide for information on other features.1.3 How to Get SupportTechnical support for Wireshark is provided by <strong>RTI</strong>; send e-mail to support@rti.com.Wireshark is an open source product. For information about Wireshark support, pleasevisit www.wireshark.org.1-4
Chapter 2InstallationTo install Wireshark, you need to login as super-user on Linux and Solaris systems, or asadministrator on Windows systems.You will also need super-user/administrator access to capture packets. (With normaluser access, you will be able to run Wireshark, but only to view previously-saved capturefiles.)2. Installation2.1 Before InstallationIf you have Ethereal, Wireshark, or <strong>RTI</strong> Protocol Analyzer with Wireshark installed, wehighly recommend that you remove them before installing <strong>RTI</strong>’s distribution of Wireshark.On Solaris systems: If an older version of Wireshark is already installed, uninstall it byrunning this command:pkgrm wireshark2.2 Installing Wireshark on Windows Systems1. Right-click on the distribution file, Wireshark--Win32.exe, and selectRun as Administrator.2. Wireshark requires WinPcap 4.1. If WinPcap 4.1 is not already installed, it will beinstalled with Wireshark. If it is already installed, you will be asked if you want tore-install WinPcap or skip the WinPcap installation. You can safely skip reinstallingWinPcap.2-1
Installation2.3 Installing Wireshark on Linux SystemsInstall Wireshark using the RedHat Package Manager (RPM):1. Login as super-user.2. cd 3. rpm -i Wireshark--.rpmFor more information on installing RPMs, please see http://www.rpm.org.2.4 Installing Wireshark on Solaris SystemsBefore Installation:❏ Make sure you have installed the required packages listed in Section 1.1 in theRelease Notes.❏ Make sure you have modified the font cache configuration file and rebuilt thefont cache (see Section 1.1.1 in the Release Notes).❏ Make sure you have root privileges.1. cd 2. gunzip Wireshark--.gz3. pkgadd –d Wireshark--2.5 Uninstalling WiresharkTo uninstall Wireshark:❏ On Windows systems: From the Start menu, select Control Panel, Add/RemovePrograms (or Programs and Features), Wireshark.❏ On Linux and Solaris systems: While logged in as root, enter:rpm -e wireshark2-2
Chapter 3Starting WiresharkImportant!To capture packets from the network, you must run Wireshark as root/administrator.On Linux systems:# /usr/bin/wireshark &On Solaris systems:# /usr/local/bin/wireshark &On Windows systems:Use the Start menu to select Wireshark.3. Capturing Packets3-1
Starting Wireshark3-2
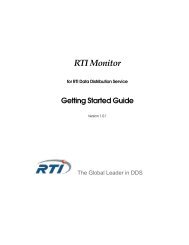
Chapter 4Capturing RTPS PacketsThis chapter describes how to capture RTPS packets that are sent across a network.After capturing packets, use the information in Chapter 5 to analyze them.Wireshark will automatically capture all RTPS packets from the wire.You can create additional filters to refine the scope of your captures. For example, youcan create filters to capture packets from specific nodes, addresses, ports, protocols, etc.This chapter provides basic instructions on using capture filters and a few examples. Formore information, see the Wireshark User’s Guide or online documentation.To capture all types of packets while running an <strong>RTI</strong> Data Distribution Service application:1. Login as super-user (on Linux/Solaris systems) or administrator (on Windowssystems).2. Start Wireshark.3. Select Capture, Options... from the menubar. Figure 4.1 shows a sample CaptureOptions window.The defaults in the Capture Option window may very well suit your needs—they will capture all packets sent to the selected interface. Then you can filter thedisplayed results with a display filter, as described in Section 5.2.1.If you want to change any of the defaults for this window, see the WiresharkUser’s Guide or online help.4. Click Start to start the capture session.4. Capturing PacketsNote The "Update list of packets in real-time" and “Hide capture info dialog”check boxes are selected by default. However, these features can slow downthe capture process and increase the chance of missing packets. We recommenddeselecting these two check boxes to limit the risk of missing packets.4-1
Capturing RTPS PacketsFigure 4.11. Select whichNetworkInterface to usefrom this pulldownselectionbox.Starting a Capture Session2. Optionally,enter a capturefilter.3. Considerturningthese off —see Note5. To stop the capture:4. Start capturing packets.• If “Hide capture info dialog” is selected, click Stop on the Capture windowor use the button located on the far right of the main window’stool bar (you may need to resize the main window to see it).• If “Hide capture info dialog” is not selected, click Stop in the Capture Dialogwindow.With the steps above, you will capture all the packets that come through your selectedinterface. Such an indiscriminate capture session may yield hundreds or thousands ofpackets. While modern computers are amazingly fast, processing each captured packetdoes take a certain amount of time. Filtering out uninteresting packets can help yousqueeze the most out of your computer. Therefore we suggest that you apply a capturefilter so that Wireshark only captures the type of packets you want to see.Simply enter a valid capture filter string in the Capture Filter box (see Figure 4.1) beforeyou press Capture. Table 4.1 provides some examples.For more information, see Wireshark’s documentation (Help, Wireshark Online, User’sGuide).4-2
Table 4.1Example Capture FiltersTo Capture ... Enter ...Capture only RTPS udp[8:4] == 0x52545053 or (ip[6:2] & 0x1FFF != 0)Only UDP packetsOnly UDP multicast packetsOnly non-UDP multicastudpudp and ip multicastudp and not ip multicastOnly UDP from/to 10.10.1.192 udp and host 10.10.1.192Only packets from IP addresses src host 10.10.100.14 and dst host 10.10.100.7410.10.100.14 to 10.10.100.74Note: Wireshark does not validate capture filter strings as they are entered. It will notalert you about an incorrect expression until after you press the Capture button. It maybe helpful for you to test your capture filter string with wireshark with the -f argumentto try a capture filter expression. (See Help, Manual Pages, wireshark.)For help analyzing captured RTPS packets, see Chapter 5.4. Capturing Packets4-3
Capturing RTPS Packets4-4
Chapter 5Analyzing RTPS PacketsThis chapter will help you interpret the submessages within captured RTPS packets.There are two levels of analysis that you may be interested in:❏ A high-level understanding of what is transpiring during a sequence of capturedRTPS packets.This chapter will help you learn to “read” a sequence of packets by walkingthrough the provided sample capture files. You may also find it helpful to reviewthe Object Discovery chapter in the <strong>RTI</strong> Data Distribution Service User’s Manual.❏ A more in-depth understanding of an individual packet’s contents.This chapter will show you how to display the decoded contents of individualpackets. Wireshark decodes each RTPS packet and shows you the value for eachfield in the packet’s structure.While the low-level details of a packet’s contents are beyond the scope of thismanual, this information is available in the Real-Time Publish-Subscribe Wire ProtocolSpecification (see Available Documentation (Section 1.1)).This chapter includes the following sections:❏ RTPS Submessage Types (Section 5.1)❏ Displaying Packets (Section 5.2)❏ Analyzing Packets from <strong>RTI</strong> Data Distribution Service Applications (Section 5.3)5. Analyzing Packets5-1
Chapter 55.1 RTPS Submessage TypesEach RTPS packet (message) consists of a header and one or more submessages. Whenyou display captured packets, the Info column (seen in Figure 5.1) lists the types of submessagesin each packet.Figure 5.1Analyzing PacketsThe Info column shows you what submessages are in each packet. The highlighted packetcontains a Reader announcement.Table 5.1 lists the submessages you may see in the Info Column. The details of each typeof submessage are described in the Real-Time Publish-Subscribe Wire Protocol Specification.5.2 Displaying PacketsWireshark has two features that make it easy to focus on packets with a particular set ofvalues:❏ Display filters limit the display to just packets that meet a set of criteria. SeeSection 5.2.1.❏ Coloring rules allow you to color-code packets based on a set of criteria so theystand out more in the full packet list. See Section 5.2.2.For more information on filters and colors, select Help, Wireshark Online, User’sGuide from the menubar.5-2
5.2 Displaying PacketsTable 5.1RTPS 2.x Submessage TypesSubmessage TypeACKNACKACKNACK_BATCHACKNACK_SESSIONDATADATA_BATCHDATA_FRAGDATA_SESSIONGAPDescriptionProvides information on the state of a Reader to a Writer.Provides information on the state of a Reader to a Writer for batched data.Provides information on the state of a Reader to a multi-channel WriterContains information regarding the value of an application Data-object. Theinformation is a fixed string with the following format:(1[23])Where:1 = a letter representing the entity ID:P (upper case) = DomainParticipantt = Built-in topic writerw = built-in publication writerr = built-in subscription writerp (lower case) = built-in participant writerm = peer-to-peer participant message writer? = unknown writer2,3 = two letters that describe the last two bits of the statusInfo inline QoS:Bit-1 Bit-0 Text-------------------------0 0 __0 1 _D1 0 U_1 1 UDWhere bit 0="Disposed" flag, and bit 1 = Unregistered flagFor example, you may see:DATA(p[__])DATA(p[_D])Contains information regarding the values of a batch of application data objects.Contains a fragment of information regarding the value of an application Dataobject.For <strong>RTI</strong> Data Distribution Service 4.2e and higher, a new format is used; capturedsubmessages of the earlier format are displayed as DATA_FRAG_deprecated.Contains information regarding the value of an application Data-object when sentby a multi-channel WriterDescribes the information that is no longer relevant to Readers.5. Analyzing Packets5-3
Chapter 5Table 5.1RTPS 2.x Submessage TypesSubmessage TypeHEARTBEATHEARTBEAT_BATCHHEARTBEAT_SESSIONINFO_SOURCEINFO_DESTINATIONINFO_REPLYINFO_REPLY2INFO_TS aNACK_FRAGNOKEY_DATANOKEY_DATA_FRAGPADDescriptionDescribes the information that is available in a Writer.Describes the information that is available in a Writer for batched data.Describes the information that is available in a multi-channel WriterProvides information about the source from which subsequent Entitysubmessages originated.Provides information about the final destination of subsequent Entitysubmessages.Provides information about where to reply to the entities that appear insubsequent submessages. The locator provided is limited to contain a singleUDPv4 address and port.Provides information about where to reply to the entities that appear insubsequent submessages. The list of locators provided allows for any transporttype and can accommodate 16-byte addresses.Provides a source timestamp for subsequent Entity submessages.Provides information on the state of a Reader to a Writer.Contains information regarding the value of an application Data-object thatcannot be referenced by a key.For <strong>RTI</strong> Data Distribution Service 4.2e and higher, this submessage is not used.Contains a fragment of information regarding the value of an application dataobjectthat cannot be referenced by a key.For <strong>RTI</strong> Data Distribution Service 4.2e and higher, this submessage is not used.Provides padding to meet any desired memory-alignment requirements.a. INFO_TS is an abbreviation for INFOTIMESTAMP5.2.1 Using a Display FilterA display filter only shows packets that match a certain set of criteria. You may want tostart by showing only RTPS packets. Wireshark provides a display filter for just this purpose.There are also predefined filters for displaying just discovery (meta) traffic, or justuser data traffic.5-4
5.2 Displaying PacketsTo display RTPS packets only:1. In the main window, clear anything you have in the filter text box with the Clearbutton, then click the Filter button.2. Select the preconfigured filter named “Only RTPS packets.”3. Click OK to close the Filter Expression window.Figure 5.2Selecting a Display Filter1. Select apredefined filter.2. Click OK5. Analyzing Packets5-5
Chapter 5As another example, let’s look at how to display only RTPS packets that containHEARTBEAT submessages.To display HEARTBEAT packets only:1. Clear anything you have in the filter text box with the Clear button, then clickthe Expression... button.2. In the new Filter Expression window, scroll down in the Field name list untilyou see RTPS. Expand the RTPS tree (click the + sign) to see the choices for thisprotocol, as seen in Figure 5.3.Figure 5.3Creating a Display FilterScroll down to RTPS or RTPS2.Click the + sign to expandthe tree.Use these fields to createa display filter.3. In the Field name list, select rtps.sm.id.4. In the Relation list, select ==.5. In the Predefined values: list, select HEARTBEAT.6. Click OK to close the Filter Expression window.7. Click Apply in the main window to apply the new filter. Now you will see onlyRTPS messages that contain a HEARTBEAT submessage, as shown in Figure 5.4.5-6
5.2 Displaying PacketsWireshark also allows you to save filter expressions for future use. For more information,see the Wireshark User’s Guide or online help.Figure 5.4Filtering by Submessage Type1. Use the Expression... button to help youenter a filter.2. Click Apply.3. Now onlypacketscontaining aHEARTBEATaredisplayed.Displaying RTPS and RTPS2 Messages:Table 5.2 briefly describes the meaning of each field that can be used in a display filterfor RTPS. To display packets for RTPS2, change the prefix from “rtps” to “rtps2.” (Thesefields can also be used in coloring rules, see Section 5.2.2.) To display both RTPS andRTPS2, rules must include both versions logically OR’ed together. For details on themeaning of these fields, see the Real-Time Publish-Subscribe Wire Protocol Specification (seeAvailable Documentation (Section 1.1)).Table 5.2Display-Filter Fields for RTPS MessagesFieldHeader fields:rtps.versionrtps.version.minorrtps.version.majorrtps.domain_idrtps.participant_idxrtps.traffic_naturertps.vendorIdDescriptionProtocol version (major.minor)Protocol minor versionProtocol major versionDomain ID of this communication (see note below)Participant index (see note below)Nature of the traffic (see note below)Vendor ID5. Analyzing Packets5-7
Chapter 5Table 5.2Display-Filter Fields for RTPS Messagesrtps.guidPrefixrtps.hostIdrtps.appIdFieldrtps.appId.instanceIdrtps.appId.appKindDescriptionGUID Prefix of the packet (this does NOT match a GUIDPrefix from a submessage)Host ID component of the packet GUID PrefixApp ID component of the packet GUID PrefixInstance ID of the App Id component of the packet GUIDPrefixApp Kind of the App Id component of the packet GUIDPrefixSubmessage-specific fields:rtps.sm.id Submessage type (see Table 5.1)rtps.sm.flagsByte representing the submessage flagsrtps.sm.octectsToTextHeaderValue of the octetsToNextHeader from the submessageheaderGeneric GUID Prefix that appears inside a submessagertps.sm.guidPrefix(this does not match the GUID Prefix of the packetheader)rtps.sm.guidPrefix.hostIdHost ID component of the submessage GUID Prefixrtps.sm.guidPrefix.appIdApp ID component of the submessage GUID Prefixrtps.sm.guidPrefix.appId.instanceIdInstanceId component of the App ID of the submessageGUID Prefixrtps.sm.guidPrefix.appId.appKindObject kind component of the App ID of the submessageGUID Prefixrtps.sm.entityIdObject entity ID as it appear in a DATA submessage(keyHashSuffix)rtps.sm.entityId.entityKey'entityKey' field of the object entity IDrtps.sm.entityId.entityKind 'entityKind' field of the object entity IDrtps.sm.rdentityIdReader entity ID as it appear in a submessagertps.sm.rdentityId.entityKey 'entityKey' field of the reader entity IDrtps.sm.rdentityId.entityKind 'entityKind' field of the reader entity IDrtps.sm.wrentityIdWriter entity ID as it appear in a submessagertps.sm.wrentityId.entityKey 'entityKey' field of the writer entity IDrtps.sm.wrentityId.entityKind 'entityKind' field of the writer entity IDrtps.sm.seqNumberWriter sequence number5-8
5.2 Displaying PacketsTable 5.2Display-Filter Fields for RTPS MessagesFieldParameters:rtps.param.idrtps.param.lengthrtps.param.ntpTimertps.param.ntpTime.secrtps.param.ntpTime.fractionrtps.param.topicNamertps.param.strengthrtps.param.typeNamertps.param.userDatartps.param.groupDatartps.param.topicDatartps.param.contentFilterNamertps.param.relatedTopicNamertps.param.filterNamertps.issueDataParameter IDParameter lengthAny generic ntpTime used in any parameterSecond part of a ntpTimeFraction part of a ntpTimeTopic associated with a PID_TOPICValue of the strength parameter in a PID_STRENGTHValue of PID_TYPE_NAMEDescriptionRaw data of PID_USER_DATARaw data of PID_GROUP_DATARaw data of PID_TOPIC_DATAValue of the content filter as sent in aPID_CONTENT_FILTER_PROPERTY parameterValue of the related topic name as sent in aPID_CONTENT_FILTER_PROPERTY parameterValue of the filter name as sent in aPID_CONTENT_FILTER_PROPERTY parameterValue of the issue data transferred in the packetsNote: The domain_id, participant_idx, and traffic_nature are described in the latestRTPS 2 specification. The values of traffic_nature correspond to the following kinds oftraffic:❏ 10 = Meta Traffic Unicast❏ 11 = User Traffic Unicast❏ 0 = Meta Traffic Multicast❏ 1 = User Traffic MulticastImportant: The packet decoder assumes the applications are using the default value forthe receive_port. Therefore, it is important to note that if the receive_port has beenexplicitly changed (in the locators.receive_port field of the TransportUnicast or TransportMulticastQosPolicy), then the domain_id, participant_idx, and traffic_nature valueswill be calculated incorrectly; in this case, these three fields should not be used in5. Analyzing Packets5-9
Chapter 5display filters nor assumed to be correct in the decoded packet view. We expect this(changing of the receive_port) to be a rare occurrence.5.2.2 Color-Coding PacketsWireshark allows you to display packets in different colors. Coloring rules are based onthe same criteria used to create display filters (described in Section 5.2.1). For instance,you can show discovery-related packets in blue and user-data packets in green. Unlikedisplay filters, coloring rules do not hide captured packets.Wireshark includes RTPS-related coloring rules that are automatically enabled; they arelisted in Table 5.3. (You can turn them off, change the colors, or edit them in other ways.See the Wireshark User’s Guide for details.) To understand the elements in the strings,refer to the Real-Time Publish-Subscribe Wire Protocol Specification (see Available Documentation(Section 1.1)). Figure 5.5 shows a sample display.Figure 5.5Using Coloring RulesColoring rules make is easy to see different types of submessages.To create a new coloring rule:1. Select View, Coloring Rules..., then click the New button to open an Edit ColorFilter window.2. Enter a name for the color filter, such as HeartBeatPackets.3. Enter a color filter expression using the same syntax as for a display filter. If youneed help, click the Expression... button. For examples, see Table 5.3.4. Select foreground (text) and background colors for packets that match the filterexpression.Tip: To select a color, click in the color-selection triangle; use the colored circle toquickly change the contents of the triangle.5-10
5.3 Analyzing Packets from <strong>RTI</strong> Data Distribution Service ApplicationsTable 5.3Default Coloring RulesColoring Rule<strong>RTI</strong> <strong>DDS</strong>Ping (green)User traffic (red)Meta traffic (blue)Non-RTPS traffic (gray)udp[16-23] == "rtiddsping"String(rtps.sm.wrEntityId.entityKind == 0x02) ||(rtps.sm.wrEntityId.entityKind == 0x03) ||(rtps2.sm.wrEntityId.entityKind == 0x02) ||(rtps2.sm.wrEntityId.entityKind == 0x03)(rtps.sm.wrEntityId.entityKind == 0xc2) ||(rtps.sm.wrEntityId.entityKind == 0xc3) ||(rtps2.sm.wrEntityId.entityKind == 0xc2) ||(rtps2.sm.wrEntityId.entityKind == 0xc3)!rtps && !rtps25. Click OK to close the Edit Color Filter window.6. Click Apply in the Coloring Rules window.Tip: The order of the coloring rules is important. The rules are applied in theorder in which they appear in the dialog box. So if there are two rules that aretrue for the same packet, the first will be used and the second one ignored. Youcan use the Up and Down buttons on the dialog to change the order of the rules.5.3 Analyzing Packets from <strong>RTI</strong> Data Distribution ServiceApplications<strong>RTI</strong>’s distribution of Wireshark includes two files that contain packets captured from <strong>RTI</strong>Data Distribution Service applications:userDataTrace.pkt A short trace of captured user data packets. This shows the flow ofpackets in an established system (after all the objects have discovered each other).discoveryTrace.pktprocess.A longer trace of the packets sent during the discovery (startup)The location of the sample files depends on your operating system:❏ Linux: /usr/share/wireshark❏ Solaris: /usr/local/share/wireshark5. Analyzing Packets5-11
Chapter 5❏ Windows: \rti (where is where Wiresharkis installed)By looking at these sample files, you will learn how to:❏ Load a captured sequence of packets from a file.❏ Understand the flow of RTPS messages by looking at a sample sequence.❏ View the contents of individual RTPS packets.Note: these sample traces were taken with a beta version of <strong>RTI</strong> Data Distribution Service(4.0f), which used RTPS 1.1. The protocol used in <strong>RTI</strong> Data Distribution Service 4.2 andhigher uses RTPS 2.x. Therefore, the actual sequence of packets exchanged will be differentin your traces. These samples are provided only to show you how to read a sequenceof RTPS packets.5.3.1 Analyzing the User Data Sample TraceUse the File, Open... command to open the file, userDataTrace.pkt (see Section 5.3 for itslocation).The sample file contains a sequence of RTPS packets that illustrate the protocol whentwo <strong>RTI</strong> Data Distribution Service 4.0 applications use reliable communications to send/receive data.This scenario involves two hosts, each running one <strong>RTI</strong> Data Distribution Service application.❏ Host 1 (10.10.100.2, named kirkwood) is running an <strong>RTI</strong> Data Distribution Servicepublishing application, App1.❏ Host 2 (10.10.50.247, named kootenay) is running an <strong>RTI</strong> Data Distribution Servicesubscribing application, App2.❏ The QoS for the writer and reader have been set up to use Reliable communications.❏ App1 writes user data every 4 seconds.To create the sample capture file, Wireshark started capturing packets on the subscribinghost (kirkwood) after the discovery process completed, using the following capture filter:udp and src or dst kootenay5-12
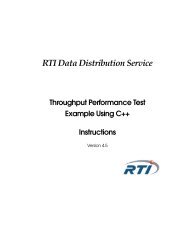
5.3 Analyzing Packets from <strong>RTI</strong> Data Distribution Service ApplicationsFigure 5.6 shows the packets captured by Wireshark, which includes three types of RTPSpackets:❏ Data from the writer to the reader❏ Acknowledgements from the reader to the writer❏ Heartbeats sent regularly from the writer to the readerTable 5.4 and Figure 5.7 describe the trace.Figure 5.6User Data Sample PacketsTable 5.4Analysis of User Data Sample TraceDirection Packet # DescriptionApp1 → App2App1 ← App2 3App1 → App2Data packet sent to the reader (NOKEY_DATA submessage).Packet has sequence number = 60 (expand the protocol tree in the1Packet Details pane and check the writerSeqNumber value, as seenin Figure 5.8).2 HEARTBEAT from writer to readerACKNACK to acknowledge all data packets up to (but notincluding) sequence number 61 (expand the protocol tree in thePacket Details pane and check the 'readerSNState.bitmapBase'value).4 Another data packet (sequence number 61).5 HEARTBEAT from writer to reader.App1 ← App2 6 Acknowledges packet #4.App1 → App27 Another data packet (sequence number 62).8 HEARTBEAT from writer to reader.App1 ← App2 9 ACKNACK to acknowledge packet #7.5. Analyzing Packets5-13
Chapter 5Figure 5.7User Data Sample Packet FlowApp1 App 2#1. NO_KEY_DATA (60)#2. HEARTBEAT#3. ACKNACK (61)#4. NO_KEY_DATA (61)#5. HEARTBEAT#6. ACKNACK (62)#7. NO_KEY_DATA (62)#8. HEARTBEAT#9. ACKNACK (63)5-14
5.3 Analyzing Packets from <strong>RTI</strong> Data Distribution Service ApplicationsFigure 5.8Examining Packet DetailsSelect a packet in the Packet ListExpand the submessage details to see the sequence number and other details.5. Analyzing Packets5-15
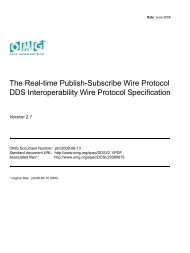
Chapter 55.3.2 Analyzing the Discovery Data Sample TraceUse the File, Open... command to open the file, discoveryTrace.pkt (see Section 5.3 forits location).The sample file contains a sequence of RTPS packets that illustrate the protocol whentwo <strong>RTI</strong> Data Distribution Service applications use best-effort communications to send/receive data.This scenario involves two hosts, each running one <strong>RTI</strong> Data Distribution Service application.❏ Host 1 (10.10.100.2) is running an <strong>RTI</strong> Data Distribution Service publishing application,App1.❏ Host 2 (10.10.50.247) is running an <strong>RTI</strong> Data Distribution Service subscribingapplication, App2.❏ Both applications have a maximum participant index of 1 and have each other intheir initial_peer_list.❏ All QoS are at default values, including the use of automatic discovery via thedefault UDPv4 transport.Wireshark was set up to start capturing packets before either application was started. Thepublishing application was started first, followed (about 6 seconds later) by the subscribingapplication. Figure 5.9 shows the packets captured by Wireshark.Let’s walk through the RTPS packets to understand what occurred in this sequence.Table 5.5 describes what happened (non-RTPS packets are omitted). In the table, theterm “meta DATA” refers to DATA packets containing meta (discovery) data (asopposed to user data).5-16
5.3 Analyzing Packets from <strong>RTI</strong> Data Distribution Service ApplicationsFigure 5.9Discovery Data Sample File5. Analyzing Packets5-17
Chapter 5Table 5.5Analysis of Sample File’s PacketsDirection Packet # DescriptionApp1 → App2 1 - 3App1 ← App2 4 - 6App1 → App27,89, 1011, 1213, 14When the writer participant starts, <strong>RTI</strong> Data Distribution Serviceannounces the creation of a new participant to all potential participants inthe initial_peer_list.Potential participants are initially calculated as:for each peer in initial_peer_list, peer/participant(i), where i
5.3 Analyzing Packets from <strong>RTI</strong> Data Distribution Service ApplicationsTable 5.5Analysis of Sample File’s PacketsDirection Packet # DescriptionApp1 ← App2App1 → App215, 1617, 1819, 20Reader participant learns about the writer participant and announces itselfto the world again.Reader participant tells the writer participant how many readers and writersit has.Reader participant asks the writer to update the reader and writer metaDATA.21 Writer, likewise, asks the reader to send updates of its reader meta DATA.22 Writer responds to #19 and tells the reader that it doesn't have any readers.App1 ← App2 23, 24 Reader refreshes its participant declaration to the world.App1 → App2 25 Writer responds to #20, saying it has 1 writer.App1 ← App226 Reader responds, asking for the writer meta DATA it hasn’t received.27 - 29App1 → App2 30App1 ← App2 31App1 → App2 32App1 ← App2 33App1 → App2 34App1 ← App2Reader participant repeats its response to the query in #21 by sending themeta DATA for its reader.Writer participant sends the meta DATA for its writer. This is a response to#26.Reader participant acknowledges the receipt of the meta DATA. This is aresponse to #22.Reader and writer participants exchange meta information about what metaDATA they have received from each other. #32 is a response to #27 (not #29).#33 is a response to #25.35Writer participant acknowledges receipt of meta DATA. This is a response to#30.36 Reader participant send meta DATA for its reader. This is a response to #32.App1 → App2 37Writer participant acknowledges receipt of this meta DATA. This is aresponse to #29.App1 ← App2 38, 39 Reader participant announces itself to the world.App1 → App240Writer responds to reader participant's query in #33. Note that this isredundant with #30 due to cross talk.41 Redundant acknowledgements.App1 ← App2 42 Redundant acknowledgements.App1 → App243 - 44 Writer reannounces itself to the world.45 - 48 Writer finally begins sending user data.5. Analyzing Packets5-19
Chapter 55-20
6. Practical UsesChapter 6Practical Uses with <strong>RTI</strong> ApplicationsThis chapter offers a few suggestions on how Wireshark can be used during <strong>RTI</strong> DataDistribution Service application development:❏ Debugging Discovery Problems (Section 6.1)❏ Visualizing Your System (Section 6.2)❏ Providing Information to <strong>RTI</strong> Support (Section 6.3)6.1 Debugging Discovery ProblemsWhile many object discovery problems are difficult to diagnose, others are quite obviousonce you use the right diagnostic tools. By inspecting all RTPS packets with Wireshark,you may be able to narrow the problem down to one of the following:❏ The participants are not discovering each other. In this case, you will see periodicsending of DATA packets, but no response from the other host that is not beingdiscovered.❏ The participants have discovered each other, but their contained readers/writersare not getting hooked up correctly. In this case, you may see HEARTBEAT andACKNACK packets for the reserved meta-data representing the reader andwriter from one participant to another, but the other participant is not respondingback in accordance to the RTPS protocol.❏ The objects have all discovered each other, but the writer is not sending userdata.In this case, you will see the discovery protocol complete successfully, butnot see DATA packets containing user data from the writer.6-1
Chapter 6When a participant containing a writer sends meta data to other participants,and those other participants respond with ACKNACK packets to acknowledgethose discovery packets, all you can say is that the declaration for that writer wasreceived by all participants in the system. But just because a participant is writingDATA packets does not necessarily mean it is writing your application’s userdata. <strong>RTI</strong> Data Distribution Service also uses DATA packets to propagate internalobject information. When in doubt, check the traffic_nature field in the decodedpacket to see how the packet is being used.A subscriber reciprocally declares its reader object with another DATA packet toall concerned participants. This happens before the writer application starts publishinguser data. <strong>RTI</strong> Data Distribution Service uses separate built-in objects toannounce and discover readers vs. writers, so it's important to check the writer-EntityId of the DATA packet to confirm that the participants in question havediscovered the reader/writer correctly.Lastly, it's important to check whether the topic and type declared in the metadata of the reader matches that in the meta data of the writer. Assuming that neitherparty is deliberately ignoring certain <strong>DDS</strong> entities (e.g. participant, topic,reader, writer), if all these were acknowledged (with ACKNACK packets), thereader participant should at this point be ready to accept user data from thewriter, and the writer will send the data to the reader. Exactly when the data willappear on the wire will depend on when the writer writes the next sample, aswell as the QoS of both the reader and writer.❏ The writer is writing your data, but the reader is not able to access that datawhen it calls read() or take(). In this case, you should check your QoS settings.Compare the writer's QoS against the reader's. Perhaps the minimum_separationin the TimeBasedFilter QosPolicy of the reader is inadvertently filtering outreceived issues.❏ Once a writer is writing user data to a data reader, the initial discovery phase isover. But there can be an "anti-discovery" problem: depending on the LivelinessQoS, <strong>RTI</strong> Data Distribution Service may purge a remote entity that it considers tobe stale. Regardless of what kind of liveliness setting you use, the main idea is toensure that your participant and its entities renew their liveliness (automaticallyor manually) within the declared duration. A classic symptom of communicationceasing due to a liveliness expiration is that a participant stops sending its periodicparticipant DATA packet. (See the <strong>RTI</strong> Data Distribution Service User’s Manualor online documentation for information about the Liveliness QosPolicy.)6-2
6.2 Visualizing Your SystemNOTE: <strong>RTI</strong> Data Distribution Service can log more detailed information aboutwhat it is doing at higher verbosity settings. See the <strong>RTI</strong> Data Distribution ServiceUser’s Manual’s Troubleshooting chapter for more information on setting verbosity.6. Practical Uses6.2 Visualizing Your SystemOnce your applications are communicating, tuning <strong>RTI</strong> Data Distribution Service to maximizeperformance may require an in-depth understanding of your network. A visualunderstanding of <strong>RTI</strong> Data Distribution Service network usage is very valuable for systemtuning.For example, you may be sending data as fast as <strong>RTI</strong> Data Distribution Service will allowand wonder why the reader cannot keep up. Wireshark itself offers many statistical analysistools under the Statistics menu.As Figures 6.1 through 6.3 show, you can see how many RTPS packets are being sent,what portion of total network bandwidth RTPS packets are taking up, which hosts aretalking to others, and how much bandwidth is being used to do so. In our “sending toofast” example, you may find that the RTPS packets are being dropped at a host with arelatively slow reader. In some extreme cases, even Wireshark may not see all the packetssent, because the network card on the sniffing machine itself dropped them.Figure 6.1UDP Conversations6-3
Chapter 6Figure 6.2I/O GraphFigure 6.3Protocol Hierarchy6-4
6.3 Providing Information to <strong>RTI</strong> Support6.3 Providing Information to <strong>RTI</strong> SupportIf you ever need to contact <strong>RTI</strong> support for an issue related to <strong>RTI</strong> Data Distribution Service,the captured packets will help <strong>RTI</strong> support diagnose the problem faster (especiallywhen accompanied by an <strong>RTI</strong> Data Distribution Service log created with a high verbositysetting).See the <strong>RTI</strong> Data Distribution Service User’s Manual’s Troubleshooting chapter for moreinformation on setting verbosity.6. Practical Uses6-5
Chapter 66-6