- Page 1: Annual Report 2006
- Page 4 and 5: VISCOFAN ANNUAL REPORT 2006Letter f
- Page 7 and 8: In 2006, our initiatives, results a
- Page 9 and 10: Milestones of Company history1975 1
- Page 11 and 12: Financial highlightsViscofan’s pe
- Page 13 and 14: Board of DirectorsChairmanDirectors
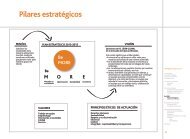
- Page 15 and 16: Corporate strategyThe market in art
- Page 17 and 18: consistent with the value our produ
- Page 19 and 20: 497.220052006374.783.657.446.626.7
- Page 21 and 22: CasingsThe casings market showed a
- Page 23 and 24: Performance bygeographical regionRe
- Page 25 and 26: Preserved vegetables (IAN Group)In
- Page 27 and 28: Today, Viscofan has twenty strategi
- Page 29 and 30: Workforce evolution4.2132.9863.4442
- Page 31 and 32: programme of control and monitoring
- Page 33 and 34: applied throughout the production p
- Page 35 and 36: Registro Mercantil de Navarra (Regi
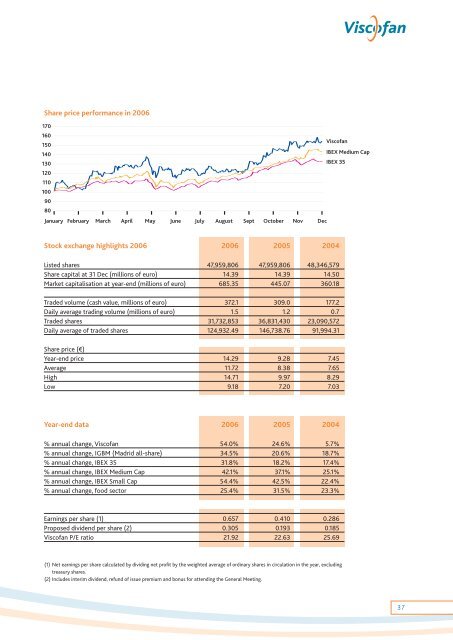
- Page 37: Directors' payThe articles of assoc
- Page 41: CellulosePlastic casingsCellulose c
- Page 44 and 45: VISCOFAN 2006 ANNUAL REPORTAnnual c
- Page 46 and 47: VISCOFAN 2006 ANNUAL REPORTAnnual c
- Page 48 and 49: VISCOFAN 2006 ANNUAL REPORTAnnual c
- Page 50: VISCOFAN 2006 ANNUAL REPORTAnnual c
- Page 53 and 54: B.1.10. Disclose, in aggregate term
- Page 55 and 56: B.1.16. Indicate whether the role o
- Page 57 and 58: If applicable, name the person(s) c
- Page 59 and 60: B.1.31. Disclose any holdings of co
- Page 61 and 62: The Audit Committee was created und
- Page 63 and 64: company and company directors or ex
- Page 65 and 66: With regard to market risk and risk
- Page 67 and 68: Article 22(c) of the Rules and Regu
- Page 69 and 70: 1.- There were approved the balance
- Page 71 and 72: E. 11. Indicate if the company is a
- Page 73: Viscofan’s business andfinancial
- Page 77 and 78: Consolidated income statements for
- Page 79 and 80: Consolidated statements of changes
- Page 81 and 82: 3.2. Comparison of informationThe c
- Page 83 and 84: Potential tax benefits from tax los
- Page 85 and 86: Replacements of property, plant and
- Page 87 and 88: 4.7. Leases(a) Finance leases:The G
- Page 89 and 90:
Derivative financial instruments ar
- Page 91 and 92:
Recoverable amounts are calculated
- Page 93 and 94:
the accrued expense, an asset is re
- Page 95 and 96:
Current and deferred tax is recogni
- Page 97 and 98:
At 31 December 2006 the Group compr
- Page 99 and 100:
Amounts recognised at the date of a
- Page 101 and 102:
8. Other Intangible AssetsDetails o
- Page 103 and 104:
Details of non-current deferred tax
- Page 105 and 106:
Spain have open to inspection by th
- Page 107 and 108:
(b) Merger reservesThese reserves d
- Page 109 and 110:
At 31 December 2006 and 2005 detail
- Page 111 and 112:
The Group also contracts exchange r
- Page 113 and 114:
Pension liabilities comprise define
- Page 115 and 116:
19. Trade payables, Other Payables
- Page 117 and 118:
Canadian Pound Czech PolishUS Dolla
- Page 119 and 120:
The table below shows interest accr
- Page 121 and 122:
The average headcount of the Group
- Page 123 and 124:
Details of remuneration by director
- Page 125 and 126:
30. Subsequent EventsOn 30 January
- Page 127 and 128:
The Viscofan Group ends 2006 with f
- Page 129 and 130:
Operations with the board of direct
- Page 131 and 132:
ActivityRegistered officesManufactu
- Page 133 and 134:
ActivityRegistered officesManufactu
- Page 135 and 136:
Geographical segments Europe North
- Page 137 and 138:
Changes inTranslationconsolidated31
- Page 139 and 140:
IncorporacionesTranslationconsolida
- Page 141 and 142:
Retained earningsLegal Special Volu
- Page 143:
Viscofan’s business andfinancial
- Page 147 and 148:
Shareholders’ Equity and Liabilit
- Page 149 and 150:
Income 2006 2005Operating incomeNet
- Page 151 and 152:
4. Significant Accounting Principle
- Page 153 and 154:
(h) Compensation for termination of
- Page 155 and 156:
5. Intangible AssetsDetails and mov
- Page 157 and 158:
At 31 December 2006 plant and machi
- Page 159 and 160:
9. DebtorsDetails at 31 December 20
- Page 161 and 162:
During 1999 this revaluation was in
- Page 163 and 164:
The Company has credit and discount
- Page 165 and 166:
16. Other CreditorsDetails at 31 De
- Page 167 and 168:
During the year deductions of Euros
- Page 169 and 170:
22. Information Relating to the Dir
- Page 171 and 172:
The legally required cash flow stat
- Page 173 and 174:
Furthermore, the installation of ne
- Page 175 and 176:
ActivityRegistered officesManufactu
- Page 177 and 178:
Reserves1996Special Merger Voluntar
- Page 179 and 180:
Sources 2006 2005Funds generated fr
- Page 181 and 182:
United StatesVISCOFAN USA Inc.50 Co
- Page 184:
www.viscofan.com