Geophysical and hydrogeologic investigation of groundwater in the ...
Geophysical and hydrogeologic investigation of groundwater in the ...
Geophysical and hydrogeologic investigation of groundwater in the ...
- No tags were found...

Create successful ePaper yourself
Turn your PDF publications into a flip-book with our unique Google optimized e-Paper software.
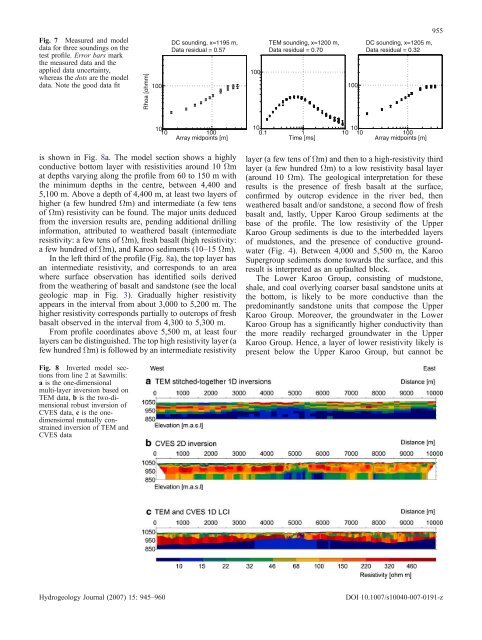
Fig. 7 Measured <strong>and</strong> modeldata for three sound<strong>in</strong>gs on <strong>the</strong>test pr<strong>of</strong>ile. Error bars mark<strong>the</strong> measured data <strong>and</strong> <strong>the</strong>applied data uncerta<strong>in</strong>ty,whereas <strong>the</strong> dots are <strong>the</strong> modeldata. Note <strong>the</strong> good data fitRhoa [ohmm]100DC sound<strong>in</strong>g, x=1195 m,Data residual = 0.57100TEM sound<strong>in</strong>g, x=1200 m,Data residual = 0.70100DC sound<strong>in</strong>g, x=1205 m,Data residual = 0.329551010 100Array midpo<strong>in</strong>ts [m]100.11Time [ms]1010 10 100Array midpo<strong>in</strong>ts [m]is shown <strong>in</strong> Fig. 8a. The model section shows a highlyconductive bottom layer with resistivities around 10 Ωmat depths vary<strong>in</strong>g along <strong>the</strong> pr<strong>of</strong>ile from 60 to 150 m with<strong>the</strong> m<strong>in</strong>imum depths <strong>in</strong> <strong>the</strong> centre, between 4,400 <strong>and</strong>5,100 m. Above a depth <strong>of</strong> 4,400 m, at least two layers <strong>of</strong>higher (a few hundred Ωm) <strong>and</strong> <strong>in</strong>termediate (a few tens<strong>of</strong> Ωm) resistivity can be found. The major units deducedfrom <strong>the</strong> <strong>in</strong>version results are, pend<strong>in</strong>g additional drill<strong>in</strong>g<strong>in</strong>formation, attributed to wea<strong>the</strong>red basalt (<strong>in</strong>termediateresistivity: a few tens <strong>of</strong> Ωm), fresh basalt (high resistivity:a few hundred <strong>of</strong> Ωm), <strong>and</strong> Karoo sediments (10–15 Ωm).In <strong>the</strong> left third <strong>of</strong> <strong>the</strong> pr<strong>of</strong>ile (Fig. 8a), <strong>the</strong> top layer hasan <strong>in</strong>termediate resistivity, <strong>and</strong> corresponds to an areawhere surface observation has identified soils derivedfrom <strong>the</strong> wea<strong>the</strong>r<strong>in</strong>g <strong>of</strong> basalt <strong>and</strong> s<strong>and</strong>stone (see <strong>the</strong> localgeologic map <strong>in</strong> Fig. 3). Gradually higher resistivityappears <strong>in</strong> <strong>the</strong> <strong>in</strong>terval from about 3,000 to 5,200 m. Thehigher resistivity corresponds partially to outcrops <strong>of</strong> freshbasalt observed <strong>in</strong> <strong>the</strong> <strong>in</strong>terval from 4,300 to 5,300 m.From pr<strong>of</strong>ile coord<strong>in</strong>ates above 5,500 m, at least fourlayers can be dist<strong>in</strong>guished. The top high resistivity layer (afew hundred Ωm) is followed by an <strong>in</strong>termediate resistivitylayer (a few tens <strong>of</strong> Ωm) <strong>and</strong> <strong>the</strong>n to a high-resistivity thirdlayer (a few hundred Ωm) to a low resistivity basal layer(around 10 Ωm). The geological <strong>in</strong>terpretation for <strong>the</strong>seresults is <strong>the</strong> presence <strong>of</strong> fresh basalt at <strong>the</strong> surface,confirmed by outcrop evidence <strong>in</strong> <strong>the</strong> river bed, <strong>the</strong>nwea<strong>the</strong>red basalt <strong>and</strong>/or s<strong>and</strong>stone, a second flow <strong>of</strong> freshbasalt <strong>and</strong>, lastly, Upper Karoo Group sediments at <strong>the</strong>base <strong>of</strong> <strong>the</strong> pr<strong>of</strong>ile. The low resistivity <strong>of</strong> <strong>the</strong> UpperKaroo Group sediments is due to <strong>the</strong> <strong>in</strong>terbedded layers<strong>of</strong> mudstones, <strong>and</strong> <strong>the</strong> presence <strong>of</strong> conductive <strong>groundwater</strong>(Fig. 4). Between 4,000 <strong>and</strong> 5,500 m, <strong>the</strong> KarooSupergroup sediments dome towards <strong>the</strong> surface, <strong>and</strong> thisresult is <strong>in</strong>terpreted as an upfaulted block.The Lower Karoo Group, consist<strong>in</strong>g <strong>of</strong> mudstone,shale, <strong>and</strong> coal overly<strong>in</strong>g coarser basal s<strong>and</strong>stone units at<strong>the</strong> bottom, is likely to be more conductive than <strong>the</strong>predom<strong>in</strong>antly s<strong>and</strong>stone units that compose <strong>the</strong> UpperKaroo Group. Moreover, <strong>the</strong> <strong>groundwater</strong> <strong>in</strong> <strong>the</strong> LowerKaroo Group has a significantly higher conductivity than<strong>the</strong> more readily recharged <strong>groundwater</strong> <strong>in</strong> <strong>the</strong> UpperKaroo Group. Hence, a layer <strong>of</strong> lower resistivity likely ispresent below <strong>the</strong> Upper Karoo Group, but cannot beFig. 8 Inverted model sectionsfrom l<strong>in</strong>e 2 at Sawmills:a is <strong>the</strong> one-dimensionalmulti-layer <strong>in</strong>version based onTEM data, b is <strong>the</strong> two-dimensionalrobust <strong>in</strong>version <strong>of</strong>CVES data, c is <strong>the</strong> onedimensionalmutually constra<strong>in</strong>ed<strong>in</strong>version <strong>of</strong> TEM <strong>and</strong>CVES dataHydrogeology Journal (2007) 15: 945–960DOI 10.1007/s10040-007-0191-z