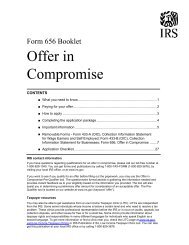
Individual Income Tax Returns, Preliminary Data, 1993Figure AAdjusted Gr6sr;*Income, Taxiable Income, and . Tota I Income T . ax, Tdx.Yearii 19.92 and 1993fNumber <strong>of</strong> returns is in thousands--money amounts are in millions <strong>of</strong> dollarsl1992 (preliminary) 1993 (preliminary)PercentageItem Number Number ncrease<strong>of</strong> Amount <strong>of</strong> mount n amountreturnsreturns(1) (2) (3) 4) 5)Adjusted gross income (less deficit) ....... 113,752 3,639;546 14,627 ,724,134 .3Taxable income....... : ...............................0,907 ,396,902 0,886 ,450,346 2Total in"come tax. .................................. 6,897 75,964 6,476 01,177 3Aftemative'minim6m tax ..................... 273 1,138 23 ,751 3.9Figure BNumber <strong>of</strong> Returns, Adjusted Gro - ss Income, and Total'income.Tax, b~ Size <strong>of</strong> Adjusted Gross Income,Tax Ybars 1992 and 1993[Number <strong>of</strong> returns is in ihousands-mohe~ amounts are in millions <strong>of</strong> dollars]Tax year,.Income'--'and taxTax Year 1993 (prelitinfinary):Number <strong>of</strong> retums .................-Adjusted.grossincome.---(less deficit) ......................Total income tax ...................Tax as a percentage<strong>of</strong> adjusted gross income(less deficit) ......................tax Year 1992 (preliminary):Number <strong>of</strong> returns .......... _.t...Adjusted gross inc<strong>of</strong>n ,e(loss deficit) ......................Total income tax ...................Tax as a percentage<strong>of</strong> adjusted gross income(less deficit) ......................Change in percentage points,tax as a percentage <strong>of</strong> adjustedgross income'l[lessdeficit), 1993 over 1992... ....Total0)114,6273,724,134501,17713.51113,752,3,639,546475,96413.10AIncludes returns With adjusted gross deficit2Percentage not computed.3Difference not computed.NOTE: Detail may riot add to totals because <strong>of</strong> rounding.Under$11(2)900-39,94132(2):937-38,69454(3)$1under$10,000(3)29,630148,127217941.929,879150,6123,0132.0-0.1$10,000. under$20,00014A24,829365,64717,8694.9'24,807365,927,18,7705.1-0.2$20,000'under -.$30,000L5117,248424,93436,0268.217,175423;12435,415...8.4-0.2 1, Size <strong>of</strong> adjusted gross income$30,000under','$50,000_(6121,445834,63786,84210.421,37T,833,36287,491-10.5-0.1$50,000under$100,000L7)16,4921,102,423145,60513.2158141.054,487'.140,41313.3-0.1$100,000under-$200.0obM3,104407,39375,W1367,86367,50318.40.1$200,000under$500.006,119)f4225,07657,85525.7746218.41952,29023.91.8$500,000under$1,000,000Mo14093,46728,31630.3141,95,31324,904,26.14.2$11.000,000ormore0 1)66162,37251,46631.767.169,735.46,11327.24.510marginal tax rates, <strong>the</strong> increase in <strong>the</strong> first AMT rate, and<strong>the</strong> introduction <strong>of</strong> a second alternative minimum ' tax ratefor 190. The lower average tax rates in <strong>the</strong> six lowestAGI size classes (Figures B and Q were mainly <strong>the</strong> result<strong>of</strong> <strong>the</strong> inflation indexing <strong>of</strong> <strong>the</strong> size <strong>of</strong> <strong>the</strong> standard deductioln,size <strong>of</strong> <strong>the</strong> deduction for personal exemptions, and<strong>the</strong>-width <strong>of</strong> <strong>the</strong> tax rate brackets. The inflation indexingcaused each <strong>of</strong> <strong>the</strong>se items to increase by about 3.0 percent,while <strong>the</strong> aggregate income for returns with AGIunder $ 100,000 grew at a rate <strong>of</strong> 1.2 percent.Selected Soumes <strong>of</strong> IncomeThe largest component <strong>of</strong> AGL salaries and wages, grewby $77.8 billion, or. 2.8 percent for 1993 (Figure D).Business or pr<strong>of</strong>ession net income (less loss) rose 2.4percent, after increasing 8.7 percent for 1992. Bo I t . h.,salaries and wages and business or pr<strong>of</strong>ession net income(less loss) grew by less than <strong>the</strong> 3.0'percent rate <strong>of</strong>inflatiori for 1993.' The growth rates <strong>of</strong> <strong>the</strong>se two itemswere also notably less than <strong>the</strong> 5.4 percent growth rate for<strong>the</strong> Gross Domestic Product [4].
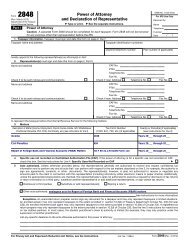
Individual Income Tax Returns, Preliminary Data, 1993Figure CTotal Income Tax as a Percentage <strong>of</strong> Adjusted Gross Income, by Size <strong>of</strong> Adjusted GrossIncome, Tax Years 1992-1993Percentage35.030.025.0019920199323.925.726.130.327.2031.720.018.4 18.515.013.3 13.210.08.4 8.210.5 10.45.05.1 4.9I0.0ME$10under$20$20under$30$30under$50$50under$100$100under$200$200under$500Size <strong>of</strong> adjusted gross Income (money amounts are In thousands <strong>of</strong> dollars)$500under$1,000I$1110GOormomFigure DComparison <strong>of</strong> Total and Selected Sources <strong>of</strong> Adjusted Gross Income, Tax Years 1992 and 1993[Number <strong>of</strong> returns is in thousands-money amounts are in millions <strong>of</strong> dollars]1992 (preliminary) 1993 (preliminary) Percentage IncreaseItem Number Number change in<strong>of</strong> Amount <strong>of</strong> Amount in amountreturns returns amount(1) (2) (3) (4) (5) (6)Adjusted gross Income (less deficit) I....................................... 113,752 3,639,546 114,627 3,724,134 2.3 84,588Salaries and wages ........................................................................... 96,588 2,814,991 98,153 2,892,838 2.8 77,847Taxable interest................................................................................. 67,471 158,504 65,193 127,056 -19.8 -31,448Dividends.......................................................................................... 23,773 77,517 24,680 79,432 2.5 1,915Business or pr<strong>of</strong>ession net income (less loss) ................................... 15,310 150,781 15,625 154,473 2.4 3,692Net capital gains (less loss) 2 ............................................................ 16,494 109,919 18,344 133,403 21.4 23,484Net gains (less loss), sales <strong>of</strong> property o<strong>the</strong>r than capital assets ...... 1,665 -2,126 1,678 -2,925(3)-799Social security benefits in adjusted gross income ............................. 5,615 23,596 5,759 25,074 6.3 1,478Rent and royalty not income (loss loss) ~.......................................... 9,941 9,930 9,949 13,761 (3) 3,831Partnership and S Corporation net income (less loss) ....................... 5,150 86,671 5,261 94,340 8.8 7,669Estate and trust net income (less loss) .............................................. 471 3,812 463 4,136(3)324Farm net income (less loss) .............................................................. 2,301 -1,695 2,276 .3,072 M -1,377Unemployment compensation ........................................................... 10,374 31,566 9,668 27,650 -12.4 -3,916Pensions and annuities in adjusted gross income ............................. 17,853 189,069 17,563 195,502 3.4 6,433Individual Retirement Arrangement distributionsin adjusted gross income ................................................................ 4,482 26,450 4,394 27,143 2.6 693O<strong>the</strong>r net income (less loss) ~ ....................n.a. , - Not available.Sources <strong>of</strong> adjusted gross Income shown am incomplete and, <strong>the</strong>refore, do not add to total adjusted gross income.2 Includes capital gain distributions reportedly separately.` Percentage changes not computed due to statistical unreliability.4Includes farm rental income less loss..O<strong>the</strong>r net Income (loss loss)* represents only data reported on <strong>the</strong> residual line on Form 1040, and does not include <strong>the</strong> foreign-eamed income exclusion.I I
- Page 1 and 2: SPRING 1995. o .............. o..o.
- Page 3 and 4: SOI BULLETINA Quarterly Statistics
- Page 5 and 6: Bulletin Board1986, the annual grow
- Page 7 and 8: Bulletin Boardmelectronic bulletin
- Page 9 and 10: Revisions to the Fall 1994 Issue0at
- Page 11: Individual Income Tax Returns, Prel
- Page 15 and 16: Individual Income Tax Returns, Prel
- Page 17 and 18: Individual Income Tax Returns, Prel
- Page 19 and 20: Individual Income Tax Returns, Prel
- Page 21 and 22: Individual Income Tax Returns, Prel
- Page 23 and 24: Individual Income Tax Returns, Prel
- Page 25 and 26: Individual Income Tax Returns, Prel
- Page 27 and 28: Individual Income Tax Returns, Prel
- Page 29 and 30: Individual Income Tax Returns, Prel
- Page 31 and 32: Foreign Recipients of U.S. Income,
- Page 33 and 34: Foreign Recipients of U.S. Income,
- Page 35 and 36: Foreign Recipients of U.S. Income,
- Page 37 and 38: Foreign Recipients of U.S. Income,
- Page 39 and 40: Foreign Recipients of U.S. Income,
- Page 41 and 42: Exempt Organization Business Income
- Page 44 and 45: Exempt Organization Business Income
- Page 46 and 47: Exempt Organization Business Income
- Page 48 and 49: Exempt Organization Business Income
- Page 50 and 51: Exempt Organization Business Income
- Page 52 and 53: Exempt Organization Business Income
- Page 54 and 55: Exempt Organization Business Income
- Page 56 and 57: Exempt Organization Business Income
- Page 58 and 59: Exempt Organizati6-n Business Incom
- Page 60 and 61: Exempt Organizaition Business Incom
- Page 62 and 63:
Exempt Organization Business Income
- Page 64 and 65:
Exempt Organization Business Income
- Page 66 and 67:
NOWHer-Proffles, Fiscal Year 1993.b
- Page 68 and 69:
Nonfiler Profiles, Fiscal Year 1993
- Page 70 and 71:
Nonfiler Profiles, Fiscal Year 1993
- Page 72 and 73:
Nonfiler Profiles, Fiscal Year 1993
- Page 74 and 75:
Nonfiler Profiles, Fiscal Year 1993
- Page 76 and 77:
S Corporation Returns, 1992Figure A
- Page 78 and 79:
.S Corporation Returns, 1992trillio
- Page 80 and 81:
S Cor*.:'- ,pg_&~A' IQn Retilms,, 1
- Page 82 and 83:
S Corporation Returns, 1992Figure I
- Page 84 and 85:
S Corporation Returns, 1992Table I.
- Page 86 and 87:
S Corporation Returns, 1992Table 1.
- Page 88 and 89:
S Corporation Returns, 1992Table 1-
- Page 90 and 91:
S Corporation Returns, 1992Table I.
- Page 92 and 93:
S Corporation Returns, 1992Table 1.
- Page 94 and 95:
S Corporation Returns, 1992Table 2.
- Page 96 and 97:
-2,956,349S Corporation Returns, 19
- Page 98 and 99:
S Corporation Returns, 1,992Table 2
- Page 100 and 101:
S Corporation Returns, 1992Table 2.
- Page 102 and 103:
S Corporation Returns, 1992Table 3.
- Page 104 and 105:
Estate Tax Retums, 1992-1993'102was
- Page 106 and 107:
Estate Tax Retums, 1992-1993Table 1
- Page 108 and 109:
Estate' Tax Retums, 1992-1993Table
- Page 110 and 111:
Estate Tax Retums, 1992-199.3Table
- Page 112 and 113:
Estate Tax Retums, 199271993Table 2
- Page 114 and 115:
Estate Tax Retums, 1992-1993Table 2
- Page 116 and 117:
Estate Tax Retums, 1992-1993Table 3
- Page 118 and 119:
Selected Historical and Other DataT
- Page 120 and 121:
Selected Historical and Other DataT
- Page 122 and 123:
Selected Historical and Other DataT
- Page 124 and 125:
Selected Historical and Other DataT
- Page 126 and 127:
Selected Historical and Other DataT
- Page 128 and 129:
Selected Historical and Other DataT
- Page 130 and 131:
Selected Historical and Other DataT
- Page 132 and 133:
Selected Historical and Other DataT
- Page 134 and 135:
Selected Historical and Other DataT
- Page 136 and 137:
Selected Historical and Other DataT
- Page 138 and 139:
Selected Historical and Other DataT
- Page 140 and 141:
Selected Historical and Other DataT
- Page 142 and 143:
Selected Historical and Other DataT
- Page 144 and 145:
Selected Historical and Other DataT
- Page 146 and 147:
Selected Historical and Other DataT
- Page 148 and 149:
Selected Historical and Other DataT
- Page 150 and 151:
Selected Historical and Other DataT
- Page 152 and 153:
Selected Historical and Other DataT
- Page 154 and 155:
Selected Historical and Other DataT
- Page 156 and 157:
Selected Historical and Other DataT
- Page 158 and 159:
Selected Historical and Other DataT
- Page 160 and 161:
Selected Historical and Other DataT
- Page 162 and 163:
Selected Historical and Other DataT
- Page 164 and 165:
Selected Historical and Other DataT
- Page 166 and 167:
Selected Historical and Other DataT
- Page 168 and 169:
Selected Historical and Other DataT
- Page 170 and 171:
Selected Historical and Other DataT
- Page 172 and 173:
Selected Historical and Other DataT
- Page 174 and 175:
Selected Historical and Other DataT
- Page 176 and 177:
Selected Historical and Other DataT
- Page 178 and 179:
Selected Historical and Other DataT
- Page 180 and 181:
10It- - - - - - - - - - - - - - - -
- Page 182 and 183:
Selected Historical and Other DataT
- Page 184 and 185:
Selected Historical and Other DataT
- Page 186 and 187:
Selected Historical and Other DataT
- Page 188 and 189:
Selected Historical and Other DataT
- Page 190 and 191:
Selected Historical and Other DataT
- Page 192 and 193:
Selected Historical and Other DataT
- Page 194 and 195:
Selected Historical and Other DataT
- Page 196 and 197:
Notes to Selected Historical and Ot
- Page 198 and 199:
Notes to Selected Historical and Ot
- Page 200 and 201:
Notes to Selected Historical and Ot
- Page 202 and 203:
Notes to Selected Historical and Ot
- Page 204 and 205:
Notes to Selected Historical and Ot
- Page 206 and 207:
Notes to Selected Historical and Ot
- Page 208 and 209:
iAnnouncing,New IRSMethodoloffRepor
- Page 210 and 211:
Publications, & Tapesment, balance
- Page 212 and 213:
'SO1 Projects and ContactsGeneral S
- Page 214 and 215:
SOI Proj6cts and ContactsGeneral St
- Page 216 and 217:
S01 Sampling Methodology and Data L
- Page 218 and 219:
S01 Sampling Methodology and DataLi
- Page 220:
IIIIDepirtment of the TreasuryInter


![l..l.l.L. 4DB.DI3-l]t] xxxxxxxxxxxxxxxx - Internal Revenue Service](https://img.yumpu.com/51302394/1/190x245/llll-4dbdi3-lt-xxxxxxxxxxxxxxxx-internal-revenue-service.jpg?quality=85)