The Philippines Health System Review - WHO Western Pacific ...
The Philippines Health System Review - WHO Western Pacific ...
The Philippines Health System Review - WHO Western Pacific ...
- No tags were found...
You also want an ePaper? Increase the reach of your titles
YUMPU automatically turns print PDFs into web optimized ePapers that Google loves.
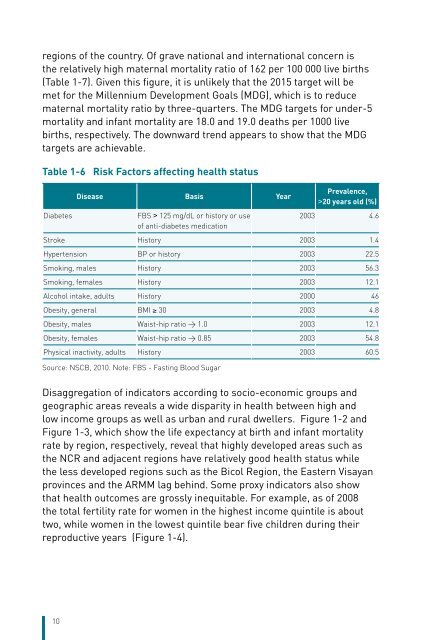
egions of the country. Of grave national and international concern isthe relatively high maternal mortality ratio of 162 per 100 000 live births(Table 1-7). Given this figure, it is unlikely that the 2015 target will bemet for the Millennium Development Goals (MDG), which is to reducematernal mortality ratio by three-quarters. <strong>The</strong> MDG targets for under-5mortality and infant mortality are 18.0 and 19.0 deaths per 1000 livebirths, respectively. <strong>The</strong> downward trend appears to show that the MDGtargets are achievable.Table 1-6 Risk Factors affecting health statusDiabetesDisease Basis YearFBS > 125 mg/dL or history or useof anti-diabetes medicationPrevalence,>20 years old (%)2003 4.6Stroke History 2003 1.4Hypertension BP or history 2003 22.5Smoking, males History 2003 56.3Smoking, females History 2003 12.1Alcohol intake, adults History 2000 46Obesity, general BMI ≥ 30 2003 4.8Obesity, males Waist-hip ratio > 1.0 2003 12.1Obesity, females Waist-hip ratio > 0.85 2003 54.8Physical inactivity, adults History 2003 60.5Source: NSCB, 2010. Note: FBS - Fasting Blood SugarDisaggregation of indicators according to socio-economic groups andgeographic areas reveals a wide disparity in health between high andlow income groups as well as urban and rural dwellers. Figure 1-2 andFigure 1-3, which show the life expectancy at birth and infant mortalityrate by region, respectively, reveal that highly developed areas such asthe NCR and adjacent regions have relatively good health status whilethe less developed regions such as the Bicol Region, the Eastern Visayanprovinces and the ARMM lag behind. Some proxy indicators also showthat health outcomes are grossly inequitable. For example, as of 2008the total fertility rate for women in the highest income quintile is abouttwo, while women in the lowest quintile bear five children during theirreproductive years (Figure 1-4).10


