Ninth international conference on - Marum
Ninth international conference on - Marum
Ninth international conference on - Marum

You also want an ePaper? Increase the reach of your titles
YUMPU automatically turns print PDFs into web optimized ePapers that Google loves.
Abstracts of posters 85<br />
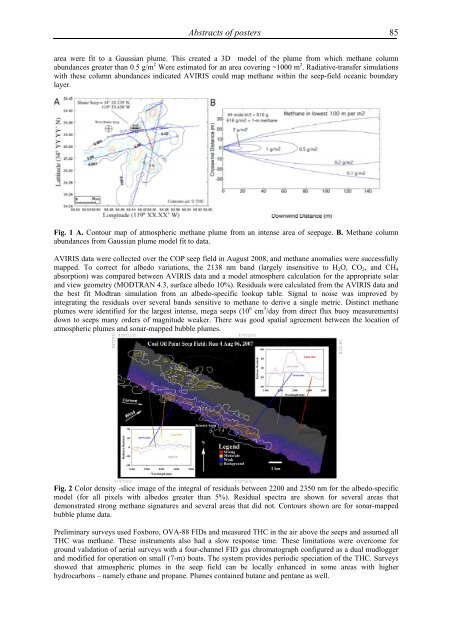
area were fit to a Gaussian plume. This created a 3D model of the plume from which methane column<br />
abundances greater than 0.5 g/m 2 Were estimated for an area covering ~1000 m 2 . Radiative-transfer simulati<strong>on</strong>s<br />
with these column abundances indicated AVIRIS could map methane within the seep-field oceanic boundary<br />
layer.<br />
Fig. 1 A. C<strong>on</strong>tour map of atmospheric methane plume from an intense area of seepage. B. Methane column<br />
abundances from Gaussian plume model fit to data.<br />
AVIRIS data were collected over the COP seep field in August 2008, and methane anomalies were successfully<br />
mapped. To correct for albedo variati<strong>on</strong>s, the 2138 nm band (largely insensitive to H2O, CO2, and CH4<br />
absorpti<strong>on</strong>) was compared between AVIRIS data and a model atmosphere calculati<strong>on</strong> for the appropriate solar<br />
and view geometry (MODTRAN 4.3, surface albedo 10%). Residuals were calculated from the AVIRIS data and<br />
the best fit Modtran simulati<strong>on</strong> from an albedo-specific lookup table. Signal to noise was improved by<br />
integrating the residuals over several bands sensitive to methane to derive a single metric. Distinct methane<br />
plumes were identified for the largest intense, mega seeps (10 6 cm 3 /day from direct flux buoy measurements)<br />
down to seeps many orders of magnitude weaker. There was good spatial agreement between the locati<strong>on</strong> of<br />
atmospheric plumes and s<strong>on</strong>ar-mapped bubble plumes.<br />
Fig. 2 Color density -slice image of the integral of residuals between 2200 and 2350 nm for the albedo-specific<br />
model (for all pixels with albedos greater than 5%). Residual spectra are shown for several areas that<br />
dem<strong>on</strong>strated str<strong>on</strong>g methane signatures and several areas that did not. C<strong>on</strong>tours shown are for s<strong>on</strong>ar-mapped<br />
bubble plume data.<br />
Preliminary surveys used Foxboro, OVA-88 FIDs and measured THC in the air above the seeps and assumed all<br />
THC was methane. These instruments also had a slow resp<strong>on</strong>se time. These limitati<strong>on</strong>s were overcome for<br />
ground validati<strong>on</strong> of aerial surveys with a four-channel FID gas chromatograph c<strong>on</strong>figured as a dual mudlogger<br />
and modified for operati<strong>on</strong> <strong>on</strong> small (7-m) boats. The system provides periodic speciati<strong>on</strong> of the THC. Surveys<br />
showed that atmospheric plumes in the seep field can be locally enhanced in some areas with higher<br />
hydrocarb<strong>on</strong>s – namely ethane and propane. Plumes c<strong>on</strong>tained butane and pentane as well.