Burma Development 1953 Vol1 Part11.pdf - Nathan Associates
Burma Development 1953 Vol1 Part11.pdf - Nathan Associates
Burma Development 1953 Vol1 Part11.pdf - Nathan Associates
- No tags were found...

Create successful ePaper yourself
Turn your PDF publications into a flip-book with our unique Google optimized e-Paper software.
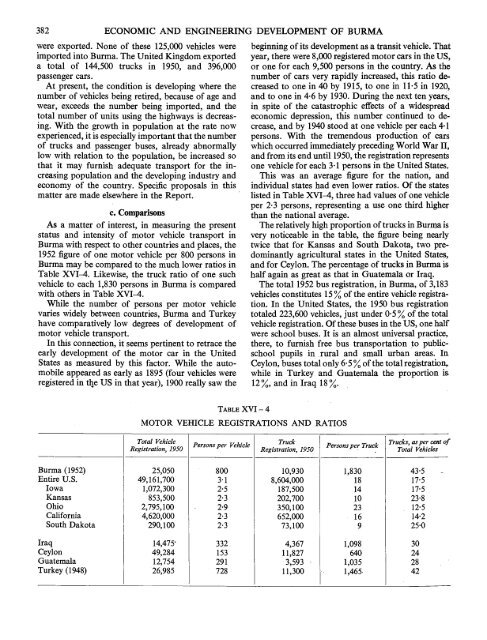
382 ECONOMIC AND ENGINEERING DEVELOPMENT OF BURMAwere exported. None of these 125,000 vehicles wereimported into <strong>Burma</strong>. The United Kingdom exporteda total of 144,500 trucks in 1950, and 396,000passenger cars.At present, the condition is developing where thenumber of vehicles being retired, because of age andwear, exceeds the number being imported, and thetotal number of units using the highways is decreas¬ing. With the growth in population at the rate nowexperienced, it is especially important that the numberof trucks and passenger buses, already abnormallylow with relation to the population, be increased sothat it may furnish adequate transport for the in¬creasing population and the developing industry andeconomy of the country. Specific proposals in thismatter are made elsewhere in the Report.c. ComparisonsAs a matter of interest, in measuring the presentstatus and intensity of motor vehicle transport in<strong>Burma</strong> with respect to other countries and places, the1952 figure of one motor vehicle per 800 persons in<strong>Burma</strong> may be compared to the much lower ratios inTable XVI-4. Likewise, the truck ratio of one suchvehicle to each 1,830 persons in <strong>Burma</strong> is comparedwith others in Table XVI-4.While the number of persons per motor vehiclevaries widely between countries, <strong>Burma</strong> and Turkeyhave comparatively low degrees of development ofmotor vehicle transport.In this connection, it seems pertinent to retrace theearly development of the motor car in the UnitedStates as measured by this factor. 'While the auto¬mobile appeared as early as 1895 (four vehicles wereregistered in the US in that year), 1900 really saw thebeginning of its development as a transit vehicle. Thatyear, there were 8,000 registered motor cars in the US,or one for each 9,500 persons in the country. As thenumber of cars very rapidly increased, this ratio de¬creased to one in 40 by 1915, to one in 11-5 in 1920,and to one in 4-6 by 1930. During the next ten years,in spite of the catastrophic effects of a widespreadeconomic depression, this number continued to de¬crease, and by 1940 stood at one vehicle per each 4-1persons. With the tremendous production of carswhich occurred immediately preceding World War II,and from its end untU 1950, the registration representsone vehicle for each 3-1 persons in the United States.This was an average figure for the nation, andindividual states had even lower ratios. Of the stateslisted in Table XVI-4, three had values of one vehicleper 2-3 persons, representing a use one third higherthan the national average.The relatively high proportion of trucks in <strong>Burma</strong> isvery noticeable in the table, the figure being nearlytwice that for Kansas and South Dakota, two pre¬dominantly agricultural states in the United States,and for Ceylon. The percentage of trucks in <strong>Burma</strong> ishalf again as great as that in Guatemala or Iraq.The total 1952 bus registration, in <strong>Burma</strong>, of 3,183vehicles constitutes 15 % of the entire vehicle registra¬tion. In the Ututed States, the 1950 bus registrationtotaled 223,600 vehicles, just under 0-5 % of the totalvehicle registration. Of these buses in the US, one halfwere school buses. It is an almost universal practice,there, to furnish free bus transportation to pubhcschoolpupUs in rural and small urban areas. InCeylon, buses total only 6-5 % of the total registration,while in Turkey and Guatemala the proportion is12%, and in Iraq 18%.TABLE XVI - 4MOTOR VEHICLE REGISTRATIONS AND RATIOSTotal VehicleRegistration, 1950Persons per VehicleTruckRegistration, 1950Persons per TruckTrucks, as per cent ofTotal Vehicles<strong>Burma</strong> (1952) 25,050 800 10,930 1,830 43-5Entire U.S. 49,161,700 3-1 8,604,000 18 17-5Iowa 1,072,300 2-5 187,500 14 17-5Kansas 853,500 2-3 202,700 10 23-8Ohio 2,795,100 2-9 350,100 23 12-5California 4,620,000 2-3 652,000 16 14-2South Dakota 290,100 2-3 73,100 9 25-0Iraq 14,475- 332 4,367 1,098 30Ceylon 49,284 153 11,827 640 24Guatemala 12,754 291 3,593 1,035 28