Burma Development 1953 Vol1 Part11.pdf - Nathan Associates
Burma Development 1953 Vol1 Part11.pdf - Nathan Associates
Burma Development 1953 Vol1 Part11.pdf - Nathan Associates
- No tags were found...

Create successful ePaper yourself
Turn your PDF publications into a flip-book with our unique Google optimized e-Paper software.
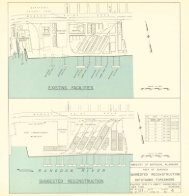
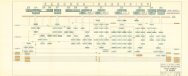
386 ECONOMIC AND ENGINEERING DEVELOPMENT OF BURMAdeveloped areas and transport systems, certain pat¬terns and peak traffic loads, but with only a moderatetotal volume, these generally do not cause congestionand undue delay at the present time. However, withthe proposed rehabilitation of the entire highway sys¬tem, it will be well to eliminate as many of the pointsof serious present congestion as is possible. Also theimprovements and new increments of the networkshould be so planned as to permit growing traffic tomove expeditiously, conveniently and safely, and thusto avoid the costly and inconvenient relocations andcorrective modifications, etc., which would otherwisehave to be made.While the limitations of time, and to an even greaterextent those of insurgency, have prevented the makingof complete traffic counts and surveys, a beginninghas been made in this direction. With the techniques,short cuts, and the processes of partial sampling thathave been developed in countries where vehiculartraffic has become a serious engineering and economicproblem, it is easily possible to conduct such surveys,to analyze the results, and to establish the several as¬pects of the total flow. This data, properly analyzedand wisely interpreted, wUl serve as the criteria for thebasic design for both present and future conditions ofthat portion of the network that is under considera¬tion.As an example of the procedure and also to estab¬lish the basic traffic data for Routes I and II in theRangoon area as an aid in the planning of local im¬provements, 12-hour traffic counts were made on May13, <strong>1953</strong>, in the viUage of Taukkyan, for traffic in eachdirection on the two routes. The 12-hour total counts,by categories of vehicles and by direction, are shownon Plate 3. In addition to the basic volumes shown thefollowing corollary facts appear:The turning movements (southbound from Route Iand east into Route II, and north from Route II intoRoute I) are small, totaling only 11 to 12 % of the totalmovements. The intersection, which is 21 miles fromdowntown Rangoon, is sufficiently rural that the pro¬portion of truck traffic resembles the "up country"pattern of Table XVI 3A rather than that of Ran¬goon Town. Of the total 12-hour flow, 57 67% istruck traffic. The proportion of buses was 15-17%of the total flow, approximately the same proportionas exists in both the Rangoon and "up country"registration.This close to Rangoon, the proportion of ox cartswas abnormally low, as compared to more rural areasnot too much farther from the capital. The animaldrawnvehicles constituted only 1 % of the total flow.Possibly too, with rice plowing in its early stages, thisfact had a bearing on this low proportion. It wasestablished from the count, and supplementary counts,that except for Sundays, there is no especiaUy notice¬able variation in traffic volume due to the day of theweek.As a start on the making of fractional counts, it wasfound that the most consistent flow occurred during7-8 a.m. and 9-10 a.m. and that the flow during eachof these two one-hour periods was close to 10% of thedaily (i.e., 12-hour) flow. As would be expected fromthe location with respect to Rangoon and smallercommunities in the area, and from normal workinghours, bus traffic was heaviest between 7 and 9 a.m.,this period accounting for more than a fourth of thetotal daily bus count.Although no exact conclusion was drawn, it appearsthat the rain storms of short duration served only todelay the anticipated bus and general flow by aboutthe same amount of time, and had no other significanteffect. The total 12-hour flow below the intersection(i.e. toward Rangoon) was 899 vehicles, that on RouteII to and from Prome totaled 541 vehicles, and thaton Route I toward Pegu totaled 484.Insurgency, as it now prevails, prevents night travel,but the travel day is more nearly 14 hours in lengththan the 12 measured. On this basis, and projectingthe trends at the start and end of the day, it appearsthat the combined flow, below Taukkyan, would totalabout 970 vehicles, the Prome (II) and Pegu (1) fuUday flows being 580 and 515 respectively. The tabula¬tions of the hourly flows for the 12-hour count on thetwo routes is shown in Table XVI-5.During the period of field investigation, trafficcounts and spot checks were made at various locationson the rural highway network, and from this data,approximate daily totals were developed. These totals,the locations at which counts were made, and pertinentdata are shown in Table XVI-6 (see p. 388).b. Urban TrafficOf the cities in <strong>Burma</strong>, only the four or five largesthave traffic problems resembhng those currentlytroubling cities in the United States and Europe wherethe vehicle population is proportionately greater.There are local problems in the smaller communities,but these are in part due to local development and inpart due to highway routing as affected by topography,direction of other roads in the area, watercourses, etc.In the larger cities, these factors plus those of vehiclevolume and inadequate control give rise to trafficcongestion and delay.While at present the congestion and delay in mostcases are not severe nor protracted enough to causeeconomic loss to the motoring and general pubhc, thesituations should be corrected in an orderly andplanned manner, to the end that developing trafficmay flow through the cities as smoothly as possible.