- Page 1 and 2:
GNU OctaveA high-level interactive
- Page 3 and 4:
iTable of ContentsPreface . . . . .
- Page 5 and 6:
10 Expressions . . . . . . . . . .
- Page 7 and 8:
19 Arithmetic . . . . . . . . . . .
- Page 9 and 10:
Appendix A Tips and Standards . . .
- Page 11 and 12:
Preface 1PrefaceOctave was original
- Page 13 and 14:
Preface 3• Tony Richardson richar
- Page 15 and 16:
Chapter 1: A Brief Introduction to
- Page 17 and 18:
Chapter 1: A Brief Introduction to
- Page 19 and 20:
Chapter 1: A Brief Introduction to
- Page 21 and 22:
Chapter 1: A Brief Introduction to
- Page 23 and 24:
Chapter 2: Getting Started 132 Gett
- Page 25 and 26:
Chapter 2: Getting Started 15argvBu
- Page 27 and 28:
Chapter 2: Getting Started 17helpCo
- Page 29 and 30:
Chapter 2: Getting Started 19clc ()
- Page 31 and 32:
Chapter 2: Getting Started 21C-rC-s
- Page 33 and 34:
Chapter 2: Getting Started 23‘\h
- Page 35 and 36:
Chapter 2: Getting Started 25Anothe
- Page 37 and 38:
Chapter 2: Getting Started 27usage:
- Page 39 and 40:
Chapter 3: Data Types 293 Data Type
- Page 41 and 42:
Chapter 3: Data Types 31size (a, n)
- Page 43 and 44:
Chapter 4: Numeric Data Types 334 N
- Page 45 and 46:
Chapter 4: Numeric Data Types 35war
- Page 47 and 48:
Chapter 4: Numeric Data Types 37Emp
- Page 49 and 50:
Chapter 5: Strings 395 StringsA str
- Page 51 and 52:
Chapter 5: Strings 41string fill ch
- Page 53 and 54:
Chapter 5: Strings 435.3 String Con
- Page 55 and 56:
Chapter 5: Strings 45toupper (s)Bui
- Page 57 and 58:
Chapter 6: Data Structures 476 Data
- Page 59 and 60:
Chapter 6: Data Structures 49octave
- Page 61 and 62:
Chapter 7: Containers 517 Container
- Page 63 and 64:
Chapter 8: I/O Streams 538 I/O Stre
- Page 65 and 66:
Chapter 9: Variables 559 VariablesV
- Page 67 and 68:
Chapter 9: Variables 57persistent p
- Page 69 and 70:
Chapter 9: Variables 59exist (name,
- Page 71 and 72:
Chapter 9: Variables 61default_save
- Page 73 and 74:
Chapter 9: Variables 63warn_divide_
- Page 75 and 76:
Chapter 10: Expressions 6510 Expres
- Page 77 and 78:
Chapter 10: Expressions 67sqrt (arg
- Page 79 and 80:
Chapter 10: Expressions 69x - ySubt
- Page 81 and 82:
Chapter 10: Expressions 7110.5.1 El
- Page 83 and 84:
Chapter 10: Expressions 73z = 1Afte
- Page 85 and 86:
Chapter 10: Expressions 75++x--xThi
- Page 87 and 88:
Chapter 11: Evaluation 7711 Evaluat
- Page 89 and 90:
Chapter 12: Statements 7912 Stateme
- Page 91 and 92:
Chapter 12: Statements 81warn assig
- Page 93 and 94:
Chapter 12: Statements 83while (con
- Page 95 and 96:
Chapter 12: Statements 85for [ val,
- Page 97 and 98:
Chapter 12: Statements 87# print el
- Page 99 and 100:
Chapter 12: Statements 89For contin
- Page 101 and 102:
Chapter 13: Functions and Script Fi
- Page 103 and 104:
Chapter 13: Functions and Script Fi
- Page 105 and 106:
Chapter 13: Functions and Script Fi
- Page 107 and 108:
Chapter 13: Functions and Script Fi
- Page 109 and 110:
Chapter 13: Functions and Script Fi
- Page 111 and 112:
Chapter 13: Functions and Script Fi
- Page 113 and 114:
Chapter 13: Functions and Script Fi
- Page 115 and 116:
Chapter 14: Error Handling 10514 Er
- Page 117 and 118:
Chapter 15: Debugging 10715 Debuggi
- Page 119 and 120:
Chapter 16: Input and Output 10916
- Page 121 and 122:
Chapter 16: Input and Output 111for
- Page 123 and 124:
Chapter 16: Input and Output 113bit
- Page 125 and 126:
Chapter 16: Input and Output 115-ma
- Page 127 and 128:
Chapter 16: Input and Output 117The
- Page 129 and 130:
Chapter 16: Input and Output 119‘
- Page 131 and 132:
Chapter 16: Input and Output 121Thi
- Page 133 and 134:
Chapter 16: Input and Output 123‘
- Page 135 and 136:
Chapter 16: Input and Output 12516.
- Page 137 and 138:
Chapter 16: Input and Output 127max
- Page 139 and 140:
Chapter 16: Input and Output 129[nr
- Page 141 and 142:
Chapter 16: Input and Output 131Con
- Page 143 and 144:
Chapter 16: Input and Output 133SEE
- Page 145 and 146:
Chapter 17: Plotting 13517 Plotting
- Page 147 and 148:
Chapter 17: Plotting 137hold argsBu
- Page 149 and 150:
Chapter 17: Plotting 13917.2 Specia
- Page 151 and 152:
Chapter 17: Plotting 141‘#’ Set
- Page 153 and 154:
Chapter 17: Plotting 14317.5 Multip
- Page 155 and 156:
Chapter 17: Plotting 145The express
- Page 157 and 158:
Chapter 17: Plotting 147Note that N
- Page 159 and 160:
Chapter 18: Matrix Manipulation 149
- Page 161 and 162:
Chapter 18: Matrix Manipulation 151
- Page 163 and 164:
Chapter 18: Matrix Manipulation 153
- Page 165 and 166: Chapter 18: Matrix Manipulation 155
- Page 167 and 168: Chapter 18: Matrix Manipulation 157
- Page 169 and 170: Chapter 18: Matrix Manipulation 159
- Page 171 and 172: Chapter 18: Matrix Manipulation 161
- Page 173 and 174: Chapter 19: Arithmetic 16319 Arithm
- Page 175 and 176: Chapter 19: Arithmetic 165min (x, y
- Page 177 and 178: Chapter 19: Arithmetic 16719.3 Trig
- Page 179 and 180: Chapter 19: Arithmetic 16919.4 Sums
- Page 181 and 182: Chapter 19: Arithmetic 171beta (a,
- Page 183 and 184: Chapter 19: Arithmetic 173[x, y] =
- Page 185 and 186: Chapter 20: Linear Algebra 17520 Li
- Page 187 and 188: Chapter 20: Linear Algebra 177If a
- Page 189 and 190: Chapter 20: Linear Algebra 179q =r
- Page 191 and 192: Chapter 20: Linear Algebra 181size
- Page 193 and 194: Chapter 20: Linear Algebra 183kron
- Page 195 and 196: Chapter 21: Nonlinear Equations 185
- Page 197 and 198: Chapter 22: Quadrature 18722 Quadra
- Page 199 and 200: Chapter 23: Differential Equations
- Page 201 and 202: Chapter 23: Differential Equations
- Page 203 and 204: Chapter 23: Differential Equations
- Page 205 and 206: Chapter 23: Differential Equations
- Page 207 and 208: Chapter 23: Differential Equations
- Page 209 and 210: Chapter 24: Optimization 19924 Opti
- Page 211 and 212: Chapter 25: Statistics 20125 Statis
- Page 213 and 214: Chapter 25: Statistics 203var (x)Fu
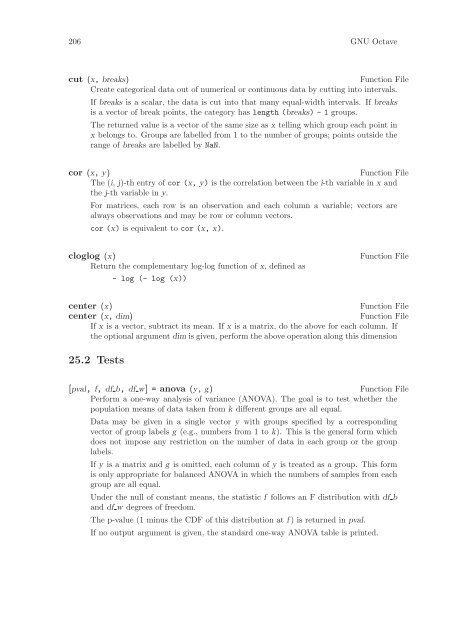
- Page 215: Chapter 25: Statistics 205moment (x
- Page 219 and 220: Chapter 25: Statistics 209kolmogoro
- Page 221 and 222: Chapter 25: Statistics 211[pval, t,
- Page 223 and 224: Chapter 25: Statistics 213[pval, z]
- Page 225 and 226: Chapter 25: Statistics 215binomial
- Page 227 and 228: Chapter 25: Statistics 217exponenti
- Page 229 and 230: Chapter 25: Statistics 219hypergeom
- Page 231 and 232: Chapter 25: Statistics 221normal cd
- Page 233 and 234: Chapter 25: Statistics 223t cdf (x,
- Page 235 and 236: Chapter 26: Financial Functions 225
- Page 237 and 238: Chapter 27: Sets 22727 SetsOctave h
- Page 239 and 240: Chapter 28: Polynomial Manipulation
- Page 241 and 242: Chapter 28: Polynomial Manipulation
- Page 243 and 244: Chapter 29: Control Theory 23329 Co
- Page 245 and 246: Chapter 29: Control Theory 23529.1.
- Page 247 and 248: Chapter 29: Control Theory 237outli
- Page 249 and 250: Chapter 29: Control Theory 239nnzst
- Page 251 and 252: Chapter 29: Control Theory 241[zer,
- Page 253 and 254: Chapter 29: Control Theory 243Examp
- Page 255 and 256: Chapter 29: Control Theory 245A mat
- Page 257 and 258: Chapter 29: Control Theory 247clstu
- Page 259 and 260: Chapter 29: Control Theory 249_____
- Page 261 and 262: Chapter 29: Control Theory 251dsysa
- Page 263 and 264: Chapter 29: Control Theory 253retsy
- Page 265 and 266: Chapter 29: Control Theory 25529.5
- Page 267 and 268:
Chapter 29: Control Theory 257dlyap
- Page 269 and 270:
Chapter 29: Control Theory 25929.6
- Page 271 and 272:
Chapter 29: Control Theory 261retva
- Page 273 and 274:
Chapter 29: Control Theory 263sysef
- Page 275 and 276:
Chapter 29: Control Theory 265d2c (
- Page 277 and 278:
Chapter 29: Control Theory 267[y, t
- Page 279 and 280:
Chapter 29: Control Theory 269absys
- Page 281 and 282:
Chapter 29: Control Theory 271siso
- Page 283 and 284:
Chapter 29: Control Theory 273[k, p
- Page 285 and 286:
Chapter 29: Control Theory 275gmaxg
- Page 287 and 288:
Chapter 29: Control Theory 277syssi
- Page 289 and 290:
Chapter 29: Control Theory 279[rlda
- Page 291 and 292:
Chapter 29: Control Theory 281[a, b
- Page 293 and 294:
Chapter 30: Signal Processing 28330
- Page 295 and 296:
Chapter 30: Signal Processing 285wh
- Page 297 and 298:
Chapter 30: Signal Processing 287[1
- Page 299 and 300:
Chapter 30: Signal Processing 289hu
- Page 301 and 302:
Chapter 31: Image Processing 29131
- Page 303 and 304:
Chapter 31: Image Processing 293hsv
- Page 305 and 306:
Chapter 32: Audio Processing 29532
- Page 307 and 308:
Chapter 33: Quaternions 29733 Quate
- Page 309 and 310:
Chapter 34: System Utilities 29934
- Page 311 and 312:
Chapter 34: System Utilities 301asc
- Page 313 and 314:
Chapter 34: System Utilities 303eti
- Page 315 and 316:
Chapter 34: System Utilities 305[er
- Page 317 and 318:
Chapter 34: System Utilities 307fnm
- Page 319 and 320:
Chapter 34: System Utilities 309in
- Page 321 and 322:
Chapter 34: System Utilities 311[er
- Page 323 and 324:
Chapter 34: System Utilities 31334.
- Page 325 and 326:
Chapter 34: System Utilities 315isi
- Page 327 and 328:
Appendix A: Tips and Standards 317A
- Page 329 and 330:
Appendix A: Tips and Standards 319
- Page 331 and 332:
Appendix A: Tips and Standards 321i
- Page 333 and 334:
Appendix B: Known Causes of Trouble
- Page 335 and 336:
Appendix B: Known Causes of Trouble
- Page 337 and 338:
Appendix B: Known Causes of Trouble
- Page 339 and 340:
Appendix C: Installing Octave 329Ap
- Page 341 and 342:
Appendix C: Installing Octave 331On
- Page 343 and 344:
Appendix C: Installing Octave 333gc
- Page 345 and 346:
Appendix D: Emacs Octave Support 33
- Page 347 and 348:
Appendix D: Emacs Octave Support 33
- Page 349 and 350:
Appendix D: Emacs Octave Support 33
- Page 351 and 352:
Appendix D: Emacs Octave Support 34
- Page 353 and 354:
Appendix E: Grammar 343Appendix E G
- Page 355 and 356:
Appendix F: GNU GENERAL PUBLIC LICE
- Page 357 and 358:
Appendix F: GNU GENERAL PUBLIC LICE
- Page 359 and 360:
Appendix F: GNU GENERAL PUBLIC LICE
- Page 361 and 362:
Concept Index 351Concept Index#‘#
- Page 363 and 364:
Concept Index 353Iif statement . .
- Page 365 and 366:
Variable Index 355Variable IndexAan
- Page 367 and 368:
Function Index 357Function Index(([
- Page 369 and 370:
Function Index 359errorbar . . . .
- Page 371 and 372:
Function Index 361isnumeric . . . .
- Page 373 and 374:
Function Index 363qzval . . . . . .
- Page 375 and 376:
Function Index 365vertcat. . . . .
- Page 377 and 378:
Operator Index 367Operator Index!!.


