WCT Evaluation5 Investigatin g Production Cost EstimatesNRCan-06-010715.1 General ConsiderationsTo paraphrase EPRI’s comments in its soon to be released 2006 study of Tidal In-Stream Power Plants,the economics associated with WCT systems are uncertain. Th ere have been, to date, no long termcommercial-scale de monstrations of a meaningful number of systems. Individual developers’projections of all incl usive costs suffer from a lack of maturity in the electricity generation industry,marketing hype published to attract critical private equity dollars, and a healthy dose of wishfulthinking. More dispassionate analyses seem to be <strong>for</strong>thcoming fro m those developers with several yearsof exposure to real world conditions, especially those who have advanced from the laboratory to fullscale field testing. Even more so, significant detail on cost history and projections can be gleaned fromreliance on a growing body of analysis em anating from the closely aligned tidal energy industry.Indeed, many of the initial entrants into the WCT arena will be transplants from the tidal streamindustry. Thus some degree of reliance might be made on projections generated by this slightly moredeveloped sector.Cost comparison betw een WCT systems and tidal stream sys temsFactors suggesting red uced WCT costs:1) Per kW/installed costs should be lowered due to greater capacity factors ba sed on increasedpotential operating parameters; i.e., due to the ebb and flow of tides and the inability of the tidalunits to operate below certain velocities, capacity factors on tidal units generally run between 25and 35 %. Other than scheduled and unscheduled maintenance properly sited WCT systemsshould operate close to 100% of the time. Commercial scale systems s hould have equipmentavailability factors comparable to traditional hydroelectric plants in the 90% + range.2) Generally deployed in more shallow water, requiring less sophisticated mounting structures,including less costly mounting related personnel and equipment costs3) Reduced mechanical complexity due to uni-directional flows of rivers and man made conduitsversus tidal operations. The one way current flow eliminates the need <strong>for</strong> yawing mechanismsand or variable pitch controls on blades, traits found on many tidal oriented systems,4) Generally not deployed in salt water, resulting in less corrosion5) Some WCT designs hold all electrical components out of the water, reducing the need <strong>for</strong>expensive seals, perhaps reducing O&M intervals, and reduced scheduled servicing costs due toeasier access6) Underwater cabling costs should be lower as WCT units will normally be closer to shorefacilities, as the energy conversion devices will not be far out to sea7) Smaller, thus more easily manufactured by a greater number of fabricators, using a larger varietyof possible fabrication materials and techniquesFactors suggesting increased WCT costs:1) Per kW installed costs may be greater due to lower kW system capacity over which to spreadfixed costs such as permitting, site engineering, shore equipment/facilities, transmission costs,etc.2) Icing and or debris management costs may be higher than experienced in open tidal areasVerdant Power Canada ULC 36
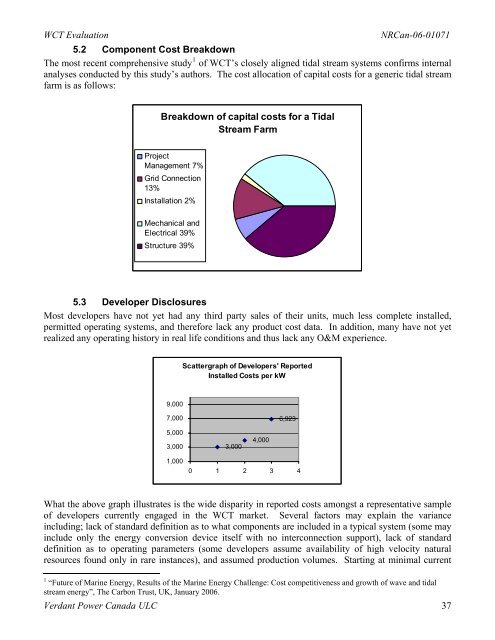
WCT EvaluationNRCan-06-010715.2 Component Cost BreakdownThe most recent comprehensive study 1 of WCT’s closely aligned tidal stream systems confirms internalanalyses conducted by this study’s authors. The cost allocation of capital costs <strong>for</strong> a generic tidal streamfarm is as follows:Breakdown of capital costs <strong>for</strong> a TidalStream FarmProjectManagement 7%Grid Connection13%Installation 2%Mechanical andElectrical 39%Structure 39%5.3 Developer DisclosuresMost developers have not yet had any third party sales of their units, much less complete installed,permitted operating systems, and there<strong>for</strong>e lack any product cost data. In addition, many have not yetrealized any operating history in real life conditions and thus lack any O&M experience.Scattergraph of Developers' ReportedInstalled Costs per kW9,0007,0006,9235,0003,0003,0004,0001,0000 1 2 3 4What th e above graph illustrates is the wide disparity in reported costs amongst a representative sampleof developers currently engaged in the WCT market. Several factors may explain the varianceincluding; lack of standard definition as to what components are included in a typical system (some mayinclude only the energy conversion device itself with no interconnection support), lack of standarddefinition as to operating parameters (some developers assume availability of high velocity naturalresources found only in rare instances), and assumed production volumes. Starting at minimal current1 “Future of Marine <strong>Energy</strong>, Results of the Marine <strong>Energy</strong> Challenge: Cost competitiveness and growth of wave and tidalstream energy”, The Carbon Trust, UK, January 2006.Verdant Power Canada ULC 37