TŽ Annual Report 2008 in pdf, 7.5 MB - TÅinecké železárny
TŽ Annual Report 2008 in pdf, 7.5 MB - TÅinecké železárny
TŽ Annual Report 2008 in pdf, 7.5 MB - TÅinecké železárny
- No tags were found...

Create successful ePaper yourself
Turn your PDF publications into a flip-book with our unique Google optimized e-Paper software.
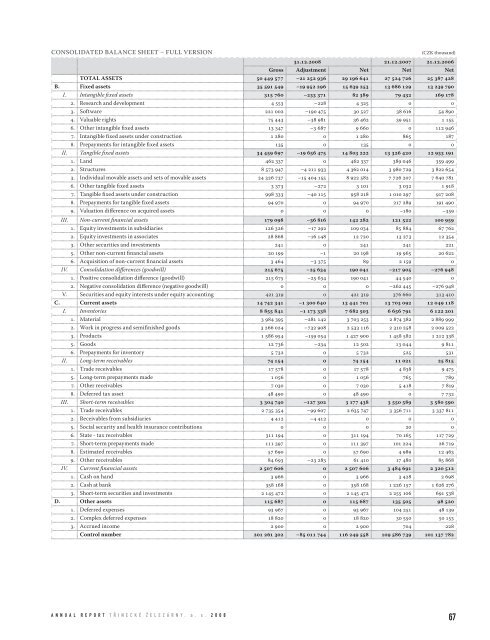
CONSOLIDATED BALANCE SHEET – FULL VERSION(CZK thousand)31.12.<strong>2008</strong> 21.12.2007 21.12.2006Gross Adjustment Net Net NetTOTAL ASSETS 50 449 577 –21 252 936 29 196 641 27 524 726 25 387 428B. Fixed assets 35 591 549 –19 952 296 15 639 253 13 686 129 13 239 790I. Intangible fixed assets 315 760 –233 371 82 389 79 432 169 1782. Research and development 4 553 –228 4 325 0 03. Software 221 002 –190 475 30 527 38 616 54 8904. Valuable rights 75 443 –38 981 36 462 39 951 1 1556. Other <strong>in</strong>tangible fixed assets 13 347 –3 687 9 660 0 112 9467. Intangible fixed assets under construction 1 280 0 1 280 865 1878. Prepayments for <strong>in</strong>tangible fixed assets 135 0 135 0 0II. Tangible fixed assets 34 459 697 –19 656 475 14 803 222 13 326 420 12 933 1911. Land 462 337 0 462 337 389 046 359 4992. Structures 8 573 947 –4 211 933 4 362 014 3 980 729 3 822 6543. Individual movable assets and sets of movable assets 24 326 737 –15 404 155 8 922 582 7 726 207 7 640 7816. Other tangible fixed assets 3 373 –272 3 101 3 032 1 9187. Tangible fixed assets under construction 998 333 –40 115 958 218 1 010 297 917 2088. Prepayments for tangible fixed assets 94 970 0 94 970 217 289 191 4909. Valuation difference on acquired assets 0 0 0 –180 –359III. Non-current f<strong>in</strong>ancial assets 179 098 –36 816 142 282 121 522 100 9591. Equity <strong>in</strong>vestments <strong>in</strong> subsidiaries 126 326 –17 292 109 034 85 884 67 7622. Equity <strong>in</strong>vestments <strong>in</strong> associates 28 868 –16 148 12 720 13 273 12 3543. Other securities and <strong>in</strong>vestments 241 0 241 241 2215. Other non-current f<strong>in</strong>ancial assets 20 199 –1 20 198 19 965 20 6226. Acquisition of non-current f<strong>in</strong>ancial assets 3 464 –3 375 89 2 159 0IV. Consolidation differences (goodwill) 215 675 –25 634 190 041 –217 905 –276 9481. Positive consolidation difference (goodwill) 215 675 –25 634 190 041 44 540 02. Negative consolidation difference (negative goodwill) 0 0 0 –262 445 –276 948V. Securities and equity <strong>in</strong>terests under equity account<strong>in</strong>g 421 319 0 421 319 376 660 313 410C. Current assets 14 742 341 –1 300 640 13 441 701 13 703 092 12 049 118I. Inventories 8 855 841 –1 173 338 7 682 503 6 656 791 6 122 2011. Material 3 984 395 –281 142 3 703 253 2 874 382 2 889 9992. Work <strong>in</strong> progress and semif<strong>in</strong>ished goods 3 266 024 –732 908 2 533 116 2 310 258 2 009 5223. Products 1 586 954 –159 054 1 427 900 1 458 582 1 212 3385. Goods 12 736 –234 12 502 13 044 9 8116. Prepayments for <strong>in</strong>ventory 5 732 0 5 732 525 531II. Long-term receivables 74 154 0 74 154 11 021 25 8151. Trade receivables 17 578 0 17 578 4 838 9 4755. Long-term prepayments made 1 056 0 1 056 765 7897. Other receivables 7 030 0 7 030 5 418 7 8198. Deferred tax asset 48 490 0 48 490 0 7 732III. Short-term receivables 3 304 740 –127 302 3 177 438 3 550 589 3 580 5901. Trade receivables 2 735 354 –99 607 2 635 747 3 356 711 3 337 8112. Receivables from subsidiaries 4 412 –4 412 0 0 05. Social security and health <strong>in</strong>surance contributions 0 0 0 20 06. State - tax receivables 311 194 0 311 194 70 165 117 7297. Short-term prepayments made 111 397 0 111 397 101 224 26 7198. Estimated receivables 57 690 0 57 690 4 989 12 4639. Other receivables 84 693 –23 283 61 410 17 480 85 868IV. Current f<strong>in</strong>ancial assets 2 507 606 0 2 507 606 3 484 691 2 320 5121. Cash on hand 3 966 0 3 966 3 428 2 6982. Cash at bank 358 168 0 358 168 1 226 157 1 626 2763. Short-term securities and <strong>in</strong>vestments 2 145 472 0 2 145 472 2 255 106 691 538D. Other assets 115 687 0 115 687 135 505 98 5201. Deferred expenses 93 967 0 93 967 104 251 48 1392. Complex deferred expenses 18 820 0 18 820 30 550 50 1533. Accrued <strong>in</strong>come 2 900 0 2 900 704 228Control number 201 261 302 –85 011 744 116 249 558 109 586 739 101 137 782A N N U A L R E P O R T T Ř I N E C K É Ž E L E Z Á R N Y , a . s . 2 0 0 867