

An R Package for Univariate and Bivariate Peaks Over Threshold ...
An R Package for Univariate and Bivariate Peaks Over Threshold ...
An R Package for Univariate and Bivariate Peaks Over Threshold ...
- No tags were found...

Create successful ePaper yourself
Turn your PDF publications into a flip-book with our unique Google optimized e-Paper software.
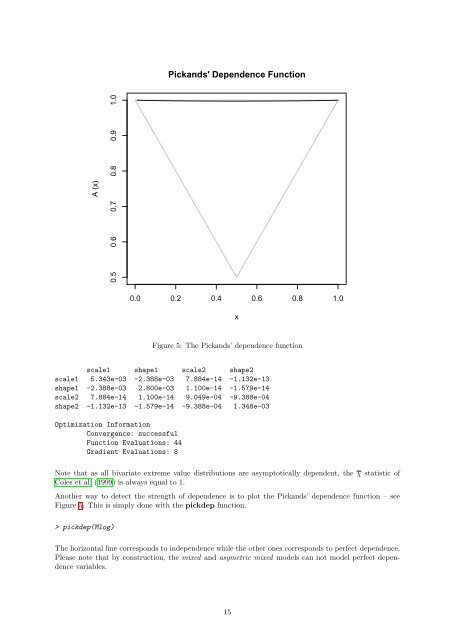
Pick<strong>and</strong>s' Dependence FunctionA (x)0.5 0.6 0.7 0.8 0.9 1.00.0 0.2 0.4 0.6 0.8 1.0xFigure 5: The Pick<strong>and</strong>s’ dependence functionscale1 shape1 scale2 shape2scale1 5.343e-03 -2.388e-03 7.884e-14 -1.132e-13shape1 -2.388e-03 2.800e-03 1.100e-14 -1.579e-14scale2 7.884e-14 1.100e-14 9.049e-04 -9.388e-04shape2 -1.132e-13 -1.579e-14 -9.388e-04 1.348e-03Optimization In<strong>for</strong>mationConvergence: successfulFunction Evaluations: 44Gradient Evaluations: 8Note that as all bivariate extreme value distributions are asymptotically dependent, the χ statistic ofColes et al. (1999) is always equal to 1.<strong>An</strong>other way to detect the strength of dependence is to plot the Pick<strong>and</strong>s’ dependence function – seeFigure 5. This is simply done with the pickdep function.> pickdep(Mlog)The horizontal line corresponds to independence while the other ones corresponds to perfect dependence.Please note that by construction, the mixed <strong>and</strong> asymetric mixed models can not model perfect dependencevariables.15


