

An R Package for Univariate and Bivariate Peaks Over Threshold ...
An R Package for Univariate and Bivariate Peaks Over Threshold ...
An R Package for Univariate and Bivariate Peaks Over Threshold ...
- No tags were found...

You also want an ePaper? Increase the reach of your titles
YUMPU automatically turns print PDFs into web optimized ePapers that Google loves.
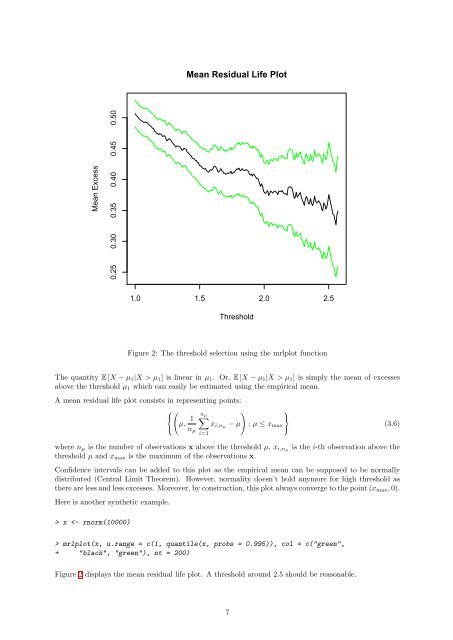
Mean Residual Life PlotMean Excess0.25 0.30 0.35 0.40 0.45 0.501.0 1.5 2.0 2.5<strong>Threshold</strong>Figure 2: The threshold selection using the mrlplot functionThe quantity E [X − µ 1 |X > µ 1 ] is linear in µ 1 . Or, E [X − µ 1 |X > µ 1 ] is simply the mean of excessesabove the threshold µ 1 which can easily be estimated using the empirical mean.A mean residual life plot consists in representing points:{(n µ) }1 ∑µ, x i,nµ − µ : µ ≤ x maxn µi=1(3.6)where n µ is the number of observations x above the threshold µ, x i,nµ is the i-th observation above thethreshold µ <strong>and</strong> x max is the maximum of the observations x.Confidence intervals can be added to this plot as the empirical mean can be supposed to be normallydistributed (Central Limit Theorem). However, normality doesn’t hold anymore <strong>for</strong> high threshold asthere are less <strong>and</strong> less excesses. Moreover, by construction, this plot always converge to the point (x max , 0).Here is another synthetic example.> x mrlplot(x, u.range = c(1, quantile(x, probs = 0.995)), col = c("green",+ "black", "green"), nt = 200)Figure 2 displays the mean residual life plot. A threshold around 2.5 should be reasonable.7


