- Page 4 and 5: 3.1.1. Number of records and surfac
- Page 6 and 7: of winter mass balance. (d) Extreme
- Page 8 and 9: PREFACEThe study of glacier fluctua
- Page 10 and 11: IntroductionThis work presents data
- Page 12 and 13: 100Number of mass balance records80
- Page 14 and 15: Four Appendices contain data:Append
- Page 16 and 17: 70×10 3 km 2 of ice caps around th
- Page 18 and 19: Nianqingtangla 7,54 Dyurgerov and M
- Page 20 and 21: Chile no inform. WGI, 1988, p. C67B
- Page 22 and 23: measurements carried out in the fie
- Page 24 and 25: 20001500a)bsataa(1-AAR)mm/yr1000500
- Page 26 and 27: w, bs, ac(AAR), aa(1-AAR), mm/yr300
- Page 28 and 29: November in the south), and summer
- Page 30 and 31: to estimate the effect of calving o
- Page 32 and 33: Golubev and Dyurgerov, 1976). Here
- Page 34 and 35: decreasing number of measurements
- Page 36 and 37: Globally averaged glacier mass bala
- Page 38 and 39: were found between published and re
- Page 40 and 41: 2.6.1 Checking data quality1. The f
- Page 42 and 43: 42PlaceSentinelSykoraTidemannWoolse
- Page 44 and 45: Praviy Aktru275118.0--No 125/Vodop.
- Page 46 and 47: Glacier Silvretta Silvretta Silvret
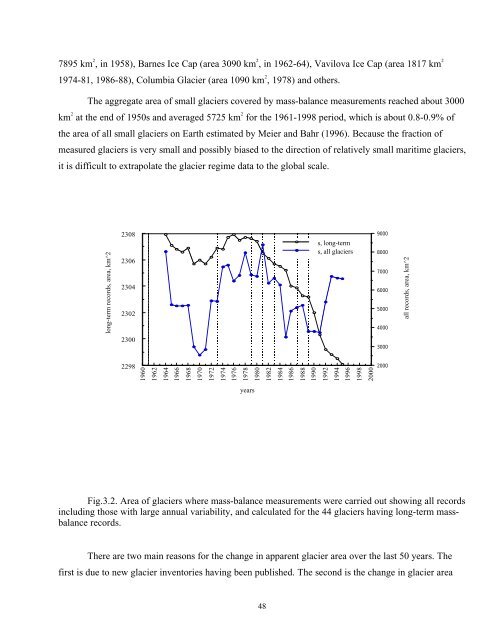
- Page 50 and 51: mass balance, all series, mm/yr, al
- Page 52 and 53: winter mass balances, mm/yr# bw2000
- Page 54 and 55: 2600# ELA80Equilibrium line altitud
- Page 56 and 57: Mass-Balance Change with Elevation.
- Page 58 and 59: 300250576 611200area, km 21501004 5
- Page 60 and 61: 5000b(z), mm/yr-500-1000-1500-2000-
- Page 62 and 63: Glacier mass-balance calculations m
- Page 64 and 65: There is a serious lack of meteorol
- Page 66 and 67: Mass balance data presented in Appe
- Page 68 and 69: Conclusions and RecommendationThis
- Page 70 and 71: 7.1. Globally-averaged mass balance
- Page 72 and 73: Auer, I., Bohm, R., Hammer, N., Sch
- Page 74 and 75: Cogley, J. G., Adams, W. P., Eccles
- Page 76 and 77: Galakhov, V. P., Narozhniy, Yu. K.,
- Page 78 and 79: Holmlund, P., Karlen W. and Grudd,
- Page 80 and 81: Jianchen Pu, Zhen Su, Tandong Yao,
- Page 82 and 83: Matsuoka, K. and Naruse, R., 1999:
- Page 84 and 85: Narozhniy, Yu. K., 1991: Balans mas
- Page 86 and 87: Rott, H., Skvarca, P., Nagler, T.,
- Page 88 and 89: Warrick, R. A., Provost, C. Le., Me
- Page 90 and 91: Explanation to Appendix 1Appendix 1
- Page 92 and 93: Explanation to Appendix 3- Blank ce
- Page 94 and 95: Appendix 1 General information on g
- Page 96 and 97: Appendix 1 General information on g
- Page 98 and 99:
References to Appendix 1FOG, 1967;
- Page 100 and 101:
Appendix 2 Mass balance versus alti
- Page 102 and 103:
Appendix 2 Mass balance versus alti
- Page 104 and 105:
Appendix 2 Mass balance versus alti
- Page 106 and 107:
Appendix 2 Mass balance versus alti
- Page 108 and 109:
Appendix 2 Mass balance versus alti
- Page 110 and 111:
Appendix 2 Mass balance versus alti
- Page 112 and 113:
Appendix 2 Mass balance versus alti
- Page 114 and 115:
Appendix 2 Mass balance versus alti
- Page 116 and 117:
Appendix 2 Mass balance versus alti
- Page 118 and 119:
Appendix 2 Mass balance versus alti
- Page 120 and 121:
Appendix 2 Mass balance versus alti
- Page 122 and 123:
Appendix 2 Mass balance versus alti
- Page 124 and 125:
Appendix 2 Mass balance versus alti
- Page 126 and 127:
Appendix 2 Mass balance versus alti
- Page 128 and 129:
Appendix 2 Mass balance versus alti
- Page 130 and 131:
Appendix 2 Mass balance versus alti
- Page 132 and 133:
Appendix 2 Mass balance versus alti
- Page 134 and 135:
Appendix 2 Mass balance versus alti
- Page 136 and 137:
Appendix 2 Mass balance versus alti
- Page 138 and 139:
Appendix 2 Mass balance versus alti
- Page 140 and 141:
Appendix 2 Mass balance versus alti
- Page 142 and 143:
Appendix 2 Mass balance versus alti
- Page 144 and 145:
Appendix 2 Mass balance versus alti
- Page 146 and 147:
Appendix 2 Mass balance versus alti
- Page 148 and 149:
Appendix 2 Mass balance versus alti
- Page 150 and 151:
Appendix 2 Mass balance versus alti
- Page 152 and 153:
Appendix 2 Mass balance versus alti
- Page 154 and 155:
Appendix 2 Mass balance versus alti
- Page 156 and 157:
Appendix 2 Mass balance versus alti
- Page 158 and 159:
Appendix 2 Mass balance versus alti
- Page 160 and 161:
Appendix 2 Mass balance versus alti
- Page 162 and 163:
Appendix 2 Mass balance versus alti
- Page 164 and 165:
Appendix 2 Mass balance versus alti
- Page 166 and 167:
Appendix 2 Mass balance versus alti
- Page 168 and 169:
Appendix 2 Mass balance versus alti
- Page 170 and 171:
Appendix 2 Mass balance versus alti
- Page 172 and 173:
Appendix 2 Mass balance versus alti
- Page 174 and 175:
Appendix 2 Mass balance versus alti
- Page 176 and 177:
Appendix 2 Mass balance versus alti
- Page 178 and 179:
Appendix 3 Annual data on glacier r
- Page 180 and 181:
Appendix 3 Annual data on glacier r
- Page 182 and 183:
Appendix 3 Annual data on glacier r
- Page 184 and 185:
Appendix 3 Annual data on glacier r
- Page 186 and 187:
Appendix 3 Annual data on glacier r
- Page 188 and 189:
Appendix 3 Annual data on glacier r
- Page 190 and 191:
Appendix 3 Annual data on glacier r
- Page 192 and 193:
Appendix 3 Annual data on glacier r
- Page 194 and 195:
Appendix 3 Annual data on glacier r
- Page 196 and 197:
Appendix 3 Annual data on glacier r
- Page 198 and 199:
Appendix 3 Annual data on glacier r
- Page 200 and 201:
Appendix 3 Annual data on glacier r
- Page 202 and 203:
Appendix 3 Annual data on glacier r
- Page 204 and 205:
Appendix 3 Annual data on glacier r
- Page 206 and 207:
Appendix 3 Annual data on glacier r
- Page 208 and 209:
Appendix 3 Annual data on glacier r
- Page 210 and 211:
Appendix 3 Annual data on glacier r
- Page 212 and 213:
Appendix 3 Annual data on glacier r
- Page 214 and 215:
Appendix 3 Annual data on glacier r
- Page 216 and 217:
Appendix 3 Annual data on glacier r
- Page 218 and 219:
Appendix 3 Annual data on glacier r
- Page 220 and 221:
Appendix 3 Annual data on glacier r
- Page 222 and 223:
Appendix 3 Annual data on glacier r
- Page 224 and 225:
Appendix 3 Annual data on glacier r
- Page 226 and 227:
Appendix 3 Annual data on glacier r
- Page 228 and 229:
Appendix 3 Annual data on glacier r
- Page 230 and 231:
Appendix 3 Annual data on glacier r
- Page 232 and 233:
Appendix 3 Annual data on glacier r
- Page 234 and 235:
Appendix 3 Annual data on glacier r
- Page 236 and 237:
Appendix 3 Annual data on glacier r
- Page 238 and 239:
Appendix 3 Annual data on glacier r
- Page 240 and 241:
Appendix 3 Annual data on glacier r
- Page 242 and 243:
Appendix 3 Annual data on glacier r
- Page 244 and 245:
Appendix 3 Annual data on glacier r
- Page 246 and 247:
Appendix 3 Annual data on glacier r
- Page 248 and 249:
Appendix 3 Annual data on glacier r
- Page 250 and 251:
Appendix 3 Annual data on glacier r
- Page 252 and 253:
Appendix 3 Annual data on glacier r
- Page 254 and 255:
Appendix 3 Annual data on glacier r
- Page 256 and 257:
Appendix 3 Annual data on glacier r
- Page 258 and 259:
Appendix 3 Annual data on glacier r
- Page 260 and 261:
Appendix 3 Annual data on glacier r
- Page 262 and 263:
Appendix 3 Annual data on glacier r
- Page 264 and 265:
Appendix 4 Glaciers with long-term
- Page 266 and 267:
Appendix 4 Glaciers with long-term
- Page 268:
Appendix 4 Glaciers with long-term