vhf-radar observations of temperature sheets in the stratospheric ...
vhf-radar observations of temperature sheets in the stratospheric ...
vhf-radar observations of temperature sheets in the stratospheric ...

You also want an ePaper? Increase the reach of your titles
YUMPU automatically turns print PDFs into web optimized ePapers that Google loves.
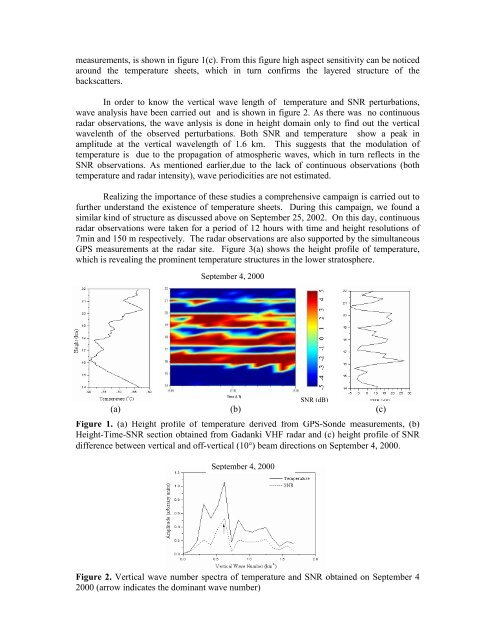
measurements, is shown <strong>in</strong> figure 1(c). From this figure high aspect sensitivity can be noticedaround <strong>the</strong> <strong>temperature</strong> <strong>sheets</strong>, which <strong>in</strong> turn confirms <strong>the</strong> layered structure <strong>of</strong> <strong>the</strong>backscatters.In order to know <strong>the</strong> vertical wave length <strong>of</strong> <strong>temperature</strong> and SNR perturbations,wave analysis have been carried out and is shown <strong>in</strong> figure 2. As <strong>the</strong>re was no cont<strong>in</strong>uous<strong>radar</strong> <strong>observations</strong>, <strong>the</strong> wave anlysis is done <strong>in</strong> height doma<strong>in</strong> only to f<strong>in</strong>d out <strong>the</strong> verticalwavelenth <strong>of</strong> <strong>the</strong> observed perturbations. Both SNR and <strong>temperature</strong> show a peak <strong>in</strong>amplitude at <strong>the</strong> vertical wavelength <strong>of</strong> 1.6 km. This suggests that <strong>the</strong> modulation <strong>of</strong><strong>temperature</strong> is due to <strong>the</strong> propagation <strong>of</strong> atmospheric waves, which <strong>in</strong> turn reflects <strong>in</strong> <strong>the</strong>SNR <strong>observations</strong>. As mentioned earlier,due to <strong>the</strong> lack <strong>of</strong> cont<strong>in</strong>uous <strong>observations</strong> (both<strong>temperature</strong> and <strong>radar</strong> <strong>in</strong>tensity), wave periodicities are not estimated.Realiz<strong>in</strong>g <strong>the</strong> importance <strong>of</strong> <strong>the</strong>se studies a comprehensive campaign is carried out t<strong>of</strong>ur<strong>the</strong>r understand <strong>the</strong> existence <strong>of</strong> <strong>temperature</strong> <strong>sheets</strong>. Dur<strong>in</strong>g this campaign, we found asimilar k<strong>in</strong>d <strong>of</strong> structure as discussed above on September 25, 2002. On this day, cont<strong>in</strong>uous<strong>radar</strong> <strong>observations</strong> were taken for a period <strong>of</strong> 12 hours with time and height resolutions <strong>of</strong>7m<strong>in</strong> and 150 m respectively. The <strong>radar</strong> <strong>observations</strong> are also supported by <strong>the</strong> simultaneousGPS measurements at <strong>the</strong> <strong>radar</strong> site. Figure 3(a) shows <strong>the</strong> height pr<strong>of</strong>ile <strong>of</strong> <strong>temperature</strong>,which is reveal<strong>in</strong>g <strong>the</strong> prom<strong>in</strong>ent <strong>temperature</strong> structures <strong>in</strong> <strong>the</strong> lower stratosphere.September 4, 2000SNR (dB)(a) (b) (c)Figure 1. (a) Height pr<strong>of</strong>ile <strong>of</strong> <strong>temperature</strong> derived from GPS-Sonde measurements, (b)Height-Time-SNR section obta<strong>in</strong>ed from Gadanki VHF <strong>radar</strong> and (c) height pr<strong>of</strong>ile <strong>of</strong> SNRdifference between vertical and <strong>of</strong>f-vertical (10°) beam directions on September 4, 2000.September 4, 2000Figure 2. Vertical wave number spectra <strong>of</strong> <strong>temperature</strong> and SNR obta<strong>in</strong>ed on September 42000 (arrow <strong>in</strong>dicates <strong>the</strong> dom<strong>in</strong>ant wave number)