EPID 766 - NCSU Statistics - North Carolina State University
EPID 766 - NCSU Statistics - North Carolina State University
EPID 766 - NCSU Statistics - North Carolina State University

Create successful ePaper yourself
Turn your PDF publications into a flip-book with our unique Google optimized e-Paper software.
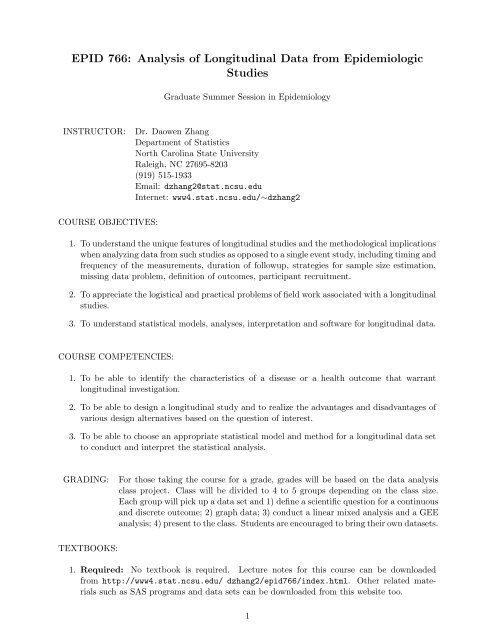
<strong>EPID</strong> <strong>766</strong>: Analysis of Longitudinal Data from Epidemiologic<br />
Studies<br />
Graduate Summer Session in Epidemiology<br />
INSTRUCTOR: Dr. Daowen Zhang<br />
Department of <strong>Statistics</strong><br />
<strong>North</strong> <strong>Carolina</strong> <strong>State</strong> <strong>University</strong><br />
Raleigh, NC 27695-8203<br />
(919) 515-1933<br />
Email: dzhang2@stat.ncsu.edu<br />
Internet: www4.stat.ncsu.edu/∼dzhang2<br />
COURSE OBJECTIVES:<br />
1. To understand the unique features of longitudinal studies and the methodological implications<br />
when analyzing data from such studies as opposed to a single event study, including timing and<br />
frequency of the measurements, duration of followup, strategies for sample size estimation,<br />
missing data problem, definition of outcomes, participant recruitment.<br />
2. To appreciate the logistical and practical problems of field work associated with a longitudinal<br />
studies.<br />
3. To understand statistical models, analyses, interpretation and software for longitudinal data.<br />
COURSE COMPETENCIES:<br />
1. To be able to identify the characteristics of a disease or a health outcome that warrant<br />
longitudinal investigation.<br />
2. To be able to design a longitudinal study and to realize the advantages and disadvantages of<br />
various design alternatives based on the question of interest.<br />
3. To be able to choose an appropriate statistical model and method for a longitudinal data set<br />
to conduct and interpret the statistical analysis.<br />
GRADING: For those taking the course for a grade, grades will be based on the data analysis<br />
class project. Class will be divided to 4 to 5 groups depending on the class size.<br />
Each group will pick up a data set and 1) define a scientific question for a continuous<br />
and discrete outcome; 2) graph data; 3) conduct a linear mixed analysis and a GEE<br />
analysis; 4) present to the class. Students are encouraged to bring their own datasets.<br />
TEXTBOOKS:<br />
1. Required: No textbook is required. Lecture notes for this course can be downloaded<br />
from http://www4.stat.ncsu.edu/ dzhang2/epid<strong>766</strong>/index.html. Other related materials<br />
such as SAS programs and data sets can be downloaded from this website too.<br />
1
2. Useful websit: The website http://www.stat.ncsu.edu/~st732_info/Davidian contains<br />
the lecture notes, examples, SAS programs, ect, from my colleague Prof. Marie Davidian’s<br />
course Applied Longitudinal Data Analysis. Take a look at this website and you<br />
may download the materials you find useful. This will be a very good source for your study<br />
and research.<br />
3. Strongly Recommended: Fitzmaurice, G.M., Laird, N.M. and Ware, J.H., Applied Longitudinal<br />
Analysis, 1st Ed., Wiley, 2004.<br />
4. Recommended: Verbeke and Molenberghs, Linear Mixed Models for Longitudinal Data, 1st<br />
Ed., Springer-Verlag: New York, 2000.<br />
5. Recommended: Diggle, Heagerty, Liang and Zeger, Analysis of Longitudinal Data, 2nd<br />
Ed., Oxford <strong>University</strong> Press, London, 2002.<br />
2
TENTATIVE SCHEDULE FOR <strong>EPID</strong> <strong>766</strong><br />
Date Hour Topic<br />
Monday 8:30 Introduction and overview<br />
9:00 Review of studies: cross-sectional studies, prospective cohort studies, retrospective<br />
(case-control) studies; motivation of longitudinal studies; formulation<br />
of the scientific questions; examples; graphical descriptions; understanding<br />
patterns of variation in longitudinal data; within vs. between subject<br />
variation, etc.<br />
10:00 Break<br />
10:15 Features of longitudinal data; challenges in analyzing longitudinal data (issues<br />
in applying standard linear regression to longitudinal data); methods<br />
of analyzing continuous (normal) longitudinal data: two-stage, linear mixed<br />
model, generalized estimating equation (GEE).<br />
11:30 Data analysis projects – Assignment<br />
Tuesday 8:30 Analyzing continuous (normal) longitudinal data using linear mixed models<br />
(Fixed effects vs. random effects, Interpretation of linear mixed models,<br />
Issues in choosing random effects and its variance-covariance matrix, Timevarying<br />
covariates, Estimates and significance tests)<br />
9:30 Break<br />
9:45 Linear mixed models (continued)<br />
10:45 Break<br />
11:00 Linear mixed models (continued)<br />
Wednesday 8:30 Modeling issues: modeling raw data vs. modeling difference, use baseline<br />
outcome as a covariate, auto-regression type of modeling, etc.; what to do if<br />
mixed model fails: GEE as a rescue, missing data issue.<br />
9:30 Break<br />
9:45 Discussion I – HIV and CD4 examples<br />
10:45 Break<br />
11:00 Design issues: recruitment and retention of participants, selection bias,<br />
sample size estimation (its relationship with within and between subject<br />
variations).<br />
3
Thursday 8:30 Discrete data: problems of applying logistic regression to longitudinal binary<br />
(binomial) data or Poisson regression to longitudinal count data – GEEs and<br />
generalized linear mixed models (GLMMs)<br />
9:30 Break<br />
9:45 GEEs and GLMMs (continued)<br />
10:45 Break<br />
11:00 GEEs and GLMMs (continued)<br />
Friday 8:30 Discussion – Menstrual cycle: binary and continuous outcomes<br />
9:30 Break<br />
9:35 Class project presentations - 3 projects (20 minutes/project)<br />
10:40 Break<br />
10:50 Class project presentations - 2 projects<br />
11:30 Summary and evaluations<br />
4
DATA ANALYSIS ASSIGNMENT FOR <strong>EPID</strong> <strong>766</strong><br />
REQUIREMENTS<br />
All individuals taking this course for credit are required to perform the data analysis assignment<br />
and to present their results on the last day of the class. Course grades will be based on the<br />
this presentation. Individuals who are not taking the course for credit are encouraged but not<br />
required to participate.<br />
The class will be divided into 4-5 groups, based on the availability of data sets and interests.<br />
To improve efficiency in working in U-M computer systems, UM students are encouraged to<br />
distribute themselves among the groups.<br />
Analysis will be preferably be conducted in SAS using Proc Mixed, Proc Genmod and Proc<br />
Nlmixed.<br />
COMPUTER ACCESS<br />
WEB site to download class data sets: http://www4.stat.ncsu.edu/∼ dzhang2/epid<strong>766</strong><br />
DATA SETS<br />
Two data sets are available to the class in addition to the ones class participants may have<br />
brought with them. One data is from the Framingham study and the other is from a study on<br />
substance use and menstrual cycle function.<br />
Please remember that all data sets are for use in this class only and should not<br />
be copied for personal use or for further analysis without explicit permission from<br />
the investigators.<br />
5
ASSIGNMENT FOR <strong>EPID</strong> <strong>766</strong><br />
Monday 1) Define a scientific question from your data set for both a continuous and<br />
binary outcome<br />
2) Provide a description of the pattern of change in independent and dependent<br />
variables over time – use graphical representation of the data<br />
Tue & Wed 3) Run a linear mixed model analysis on the continuous outcome<br />
Thursday 4) Run a GEE model and GLMM model for the binary outcome<br />
Friday 6) Present to the class<br />
6