Generation, of the energy carrier HYDROGEN In context ... - needs
Generation, of the energy carrier HYDROGEN In context ... - needs
Generation, of the energy carrier HYDROGEN In context ... - needs

Create successful ePaper yourself
Turn your PDF publications into a flip-book with our unique Google optimized e-Paper software.
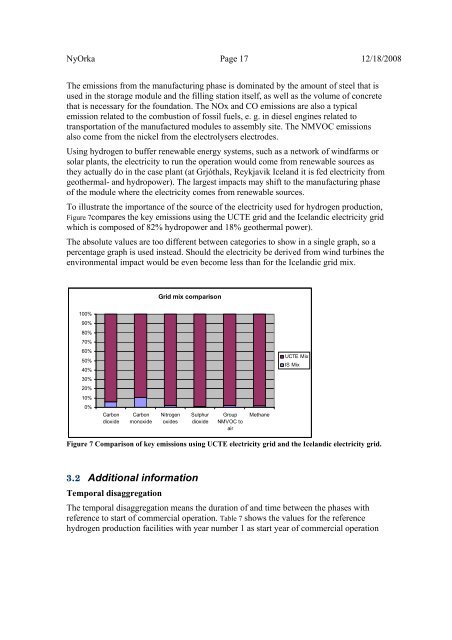
NyOrka Page 17 12/18/2008The emissions from <strong>the</strong> manufacturing phase is dominated by <strong>the</strong> amount <strong>of</strong> steel that isused in <strong>the</strong> storage module and <strong>the</strong> filling station itself, as well as <strong>the</strong> volume <strong>of</strong> concretethat is necessary for <strong>the</strong> foundation. The NOx and CO emissions are also a typicalemission related to <strong>the</strong> combustion <strong>of</strong> fossil fuels, e. g. in diesel engines related totransportation <strong>of</strong> <strong>the</strong> manufactured modules to assembly site. The NMVOC emissionsalso come from <strong>the</strong> nickel from <strong>the</strong> electrolysers electrodes.Using hydrogen to buffer renewable <strong>energy</strong> systems, such as a network <strong>of</strong> windfarms orsolar plants, <strong>the</strong> electricity to run <strong>the</strong> operation would come from renewable sources as<strong>the</strong>y actually do in <strong>the</strong> case plant (at Grjóthals, Reykjavik Iceland it is fed electricity fromgeo<strong>the</strong>rmal- and hydropower). The largest impacts may shift to <strong>the</strong> manufacturing phase<strong>of</strong> <strong>the</strong> module where <strong>the</strong> electricity comes from renewable sources.To illustrate <strong>the</strong> importance <strong>of</strong> <strong>the</strong> source <strong>of</strong> <strong>the</strong> electricity used for hydrogen production,Figure 7compares <strong>the</strong> key emissions using <strong>the</strong> UCTE grid and <strong>the</strong> Icelandic electricity gridwhich is composed <strong>of</strong> 82% hydropower and 18% geo<strong>the</strong>rmal power).The absolute values are too different between categories to show in a single graph, so apercentage graph is used instead. Should <strong>the</strong> electricity be derived from wind turbines <strong>the</strong>environmental impact would be even become less than for <strong>the</strong> Icelandic grid mix.Grid mix comparisonUCTE MixIS Mix100%90%80%70%60%50%40%30%20%10%0%CarbondioxideCarbonmonoxideNitrogenoxidesSulphurdioxideGroupNMVOC toairMethaneFigure 7 Comparison <strong>of</strong> key emissions using UCTE electricity grid and <strong>the</strong> Icelandic electricity grid.3.2 Additional informationTemporal disaggregationThe temporal disaggregation means <strong>the</strong> duration <strong>of</strong> and time between <strong>the</strong> phases withreference to start <strong>of</strong> commercial operation. Table 7 shows <strong>the</strong> values for <strong>the</strong> referencehydrogen production facilities with year number 1 as start year <strong>of</strong> commercial operation