Generation, of the energy carrier HYDROGEN In context ... - needs
Generation, of the energy carrier HYDROGEN In context ... - needs
Generation, of the energy carrier HYDROGEN In context ... - needs

Create successful ePaper yourself
Turn your PDF publications into a flip-book with our unique Google optimized e-Paper software.
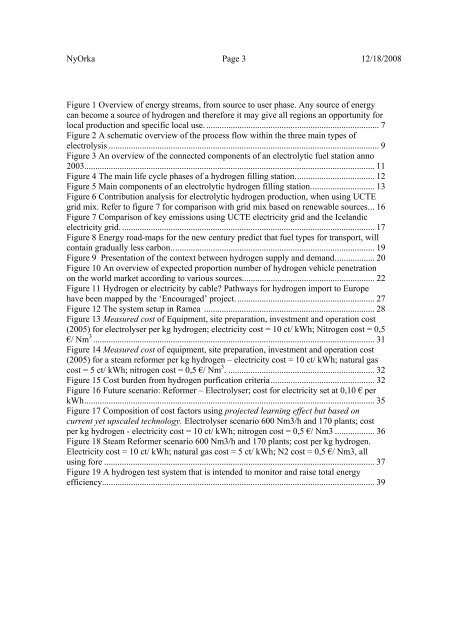
NyOrka Page 3 12/18/2008Figure 1 Overview <strong>of</strong> <strong>energy</strong> streams, from source to user phase. Any source <strong>of</strong> <strong>energy</strong>can become a source <strong>of</strong> hydrogen and <strong>the</strong>refore it may give all regions an opportunity forlocal production and specific local use. .............................................................................. 7Figure 2 A schematic overview <strong>of</strong> <strong>the</strong> process flow within <strong>the</strong> three main types <strong>of</strong>electrolysis .......................................................................................................................... 9Figure 3 An overview <strong>of</strong> <strong>the</strong> connected components <strong>of</strong> an electrolytic fuel station anno2003................................................................................................................................... 11Figure 4 The main life cycle phases <strong>of</strong> a hydrogen filling station. ................................... 12Figure 5 Main components <strong>of</strong> an electrolytic hydrogen filling station. ............................ 13Figure 6 Contribution analysis for electrolytic hydrogen production, when using UCTEgrid mix. Refer to figure 7 for comparison with grid mix based on renewable sources. .. 16Figure 7 Comparison <strong>of</strong> key emissions using UCTE electricity grid and <strong>the</strong> Icelandicelectricity grid. .................................................................................................................. 17Figure 8 Energy road-maps for <strong>the</strong> new century predict that fuel types for transport, willcontain gradually less carbon.. .......................................................................................... 19Figure 9 Presentation <strong>of</strong> <strong>the</strong> <strong>context</strong> between hydrogen supply and demand. ................. 20Figure 10 An overview <strong>of</strong> expected proportion number <strong>of</strong> hydrogen vehicle penetrationon <strong>the</strong> world market according to various sources............................................................ 22Figure 11 Hydrogen or electricity by cable? Pathways for hydrogen import to Europehave been mapped by <strong>the</strong> ‘Encouraged’ project. .............................................................. 27Figure 12 The system setup in Ramea ............................................................................. 28Figure 13 Measured cost <strong>of</strong> Equipment, site preparation, investment and operation cost(2005) for electrolyser per kg hydrogen; electricity cost = 10 ct/ kWh; Nitrogen cost = 0,5€/ Nm 3 ............................................................................................................................... 31Figure 14 Measured cost <strong>of</strong> equipment, site preparation, investment and operation cost(2005) for a steam reformer per kg hydrogen – electricity cost = 10 ct/ kWh; natural gascost = 5 ct/ kWh; nitrogen cost = 0,5 €/ Nm 3 . .................................................................. 32Figure 15 Cost burden from hydrogen purfication criteria ............................................... 32Figure 16 Future scenario: Reformer – Electrolyser; cost for electricity set at 0,10 € perkWh ................................................................................................................................... 35Figure 17 Composition <strong>of</strong> cost factors using projected learning effect but based oncurrent yet upscaled technology. Electrolyser scenario 600 Nm3/h and 170 plants; costper kg hydrogen - electricity cost = 10 ct/ kWh; nitrogen cost = 0,5 €/ Nm3 .................. 36Figure 18 Steam Reformer scenario 600 Nm3/h and 170 plants; cost per kg hydrogen.Electricity cost = 10 ct/ kWh; natural gas cost = 5 ct/ kWh; N2 cost = 0,5 €/ Nm3, allusing fore .......................................................................................................................... 37Figure 19 A hydrogen test system that is intended to monitor and raise total <strong>energy</strong>efficiency. .......................................................................................................................... 39