Chapter 6: Time Series Analysis
Chapter 6: Time Series Analysis
Chapter 6: Time Series Analysis

You also want an ePaper? Increase the reach of your titles
YUMPU automatically turns print PDFs into web optimized ePapers that Google loves.
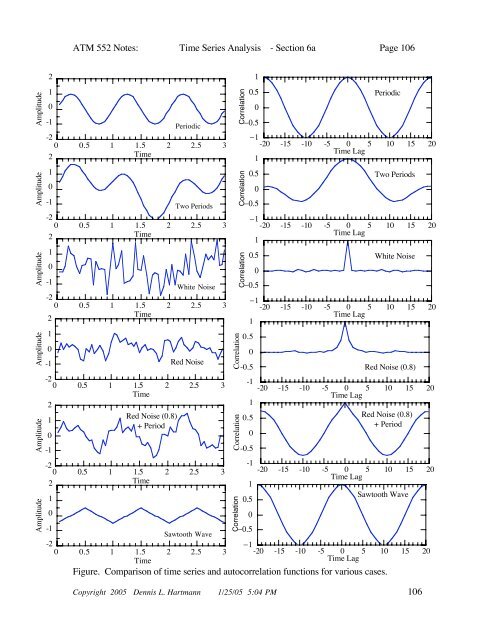
ATM 552 Notes: <strong>Time</strong> <strong>Series</strong> <strong>Analysis</strong> - Section 6a Page 106AmplitudeAmplitudeAmplitudeAmplitudeAmplitudeAmplitude210-1Periodic-20 0.5 1 1.5 2 2.5 32<strong>Time</strong>10-1Two Periods-20 0.5 1 1.5 2 2.5 32<strong>Time</strong>10-1White Noise-20 0.5 1 1.5 2 2.5 32<strong>Time</strong>10-1-20 0.5 1 1.5 2 2.5 3<strong>Time</strong>21Red Noise (0.8)+ Period0-1-20 0.5 1 1.5 2 2.5 32<strong>Time</strong>10-1Red NoiseSawtooth WaveCorrelationCorrelationCorrelationCorrelationCorrelationCorrelation1-20 -15 -10 -5 0 5 10 15 20<strong>Time</strong> Lag1-210 0.5 1 1.5 2 2.5 3 -20 -15 -10 -5 0 5 10 15 20<strong>Time</strong><strong>Time</strong> LagFigure. Comparison of time series and autocorrelation functions for various cases.0.5Copyright 2005 Dennis L. Hartmann 1/25/05 5:04 PM 10610.500.500.5PeriodicTwo Periods1-20 -15 -10 -5 0 5 10 15 20<strong>Time</strong> Lag10.500.5-0.50.5White Noise1-20 -15 -10 -5 0 5 10 15 20<strong>Time</strong> Lag10.500.50-0.5-110.50Red Noise (0.8)-1-20 -15 -10 -5 0 5 10 15 20<strong>Time</strong> Lag1Red Noise (0.8)+ Period-20 -15 -10 -5 0 5 10 15 20<strong>Time</strong> LagSawtooth Wave