Instrumentation | PorometryMeasuring Pore Size in Single Hollow FiberMembranes by Capillary Flow PorometryBy Richard Wenman and Martin A. Thomas, Quantachrome InstrumentsHollow fiber and capillarymembranes have a numberof attractive properties suchas flexibility, high surface area per unitvolume, and unique packaging opportunities,which means they can beadapted to a variety of filtration applications.However, their physical form –small diameter flexible polymeric tubes– is a challenge for determining thesizes of the largely sub-micron porespenetrating the walls. But a simple yetreliable preparation procedure combinedwith state-of-the-art laboratoryequipment can lead to successful characterizationand differentiation of singlefibers.The excellent mass-transfer propertiesof the hollow fiber construction (arelatively large lumen surrounded by alarge area of a thin porous membranewall) has led it to being utilized in numerouscommercial applications inwidely differing fields such as medical(blood fractionation), water reclamation(purification and desalination), gasseparation, and techniques using pervaporation.Other promising applicationsof this type of membrane are inthe biochemical industry (bioseparationand bioreactors). Specifically, itsbeneficial features (compared withmore traditional filtration and separationsystems) are modest energy requirements,high volume efficiency,two modes of operation (“inside-out”and “outside-in”), and low operatingcosts. To a certain extent these benefitsare offset by more-frequent fouling andinitial capital expense. The challengefaced by those needing to determinethe pore size distribution through thewalls is to find a technique which canfunctionally transfer a fluid radially,even through a single narrow fiber;making pore size measurements acrossa flat sheet, even a bundle of fibers, issimple by comparison. The difficulty ofanalyzing hollow fibers one at a timehas been overcome by a special preparationtechnique, which involves sealingan individual fiber into a specialsample holder.EXPERIMENTALPreparing a Single Hollow FiberAcrylic tube sample holders, 8mmO.D. and 30mm long were modified bydrilling the bore to 1.5mm and countersinkingeach end. Four samples ofpolymeric hollow fiber samples identifiedas samples 1, 2, 3, and 4, each havingan outside diameter of 1 mm and awall thickness of 100 µm were preparedas follows: a length of each fiber wascut and “opened” by inserting a TFEcoated wire down the lumen (center ofthe tube). This wire remained in placeduring the following procedure tomount the hollow fiber in the holder:the sample was glued and sealed insidethe acrylic using quick-drying epoxyresin. The loose end of the fiber wasalso sealed with the glue. After the gluehad started to harden in 2 or 3 minutes,the wire was removed.ANALYSISPore size distributions were determinedusing a Porometer 3Gz (QuantachromeInstruments, Boynton Beach,FL USA). The completed sample holderswere installed in an external samplemanifold (see Figure 2) in place of theusual sample holder assembly andblock. After wetting a sample with Porofilwetting fluid (Quantachrome)Figure 1. Sample mounted and glued in acrylic sample holder. The arrow showssealed fiber end.18 • October 2011 • www.filtnews.comFigure 2: External Sample ManifoldThe red arrow indicates the attachmentpoint for the acrylic sample holder. Thecylinder is a buffer volume.
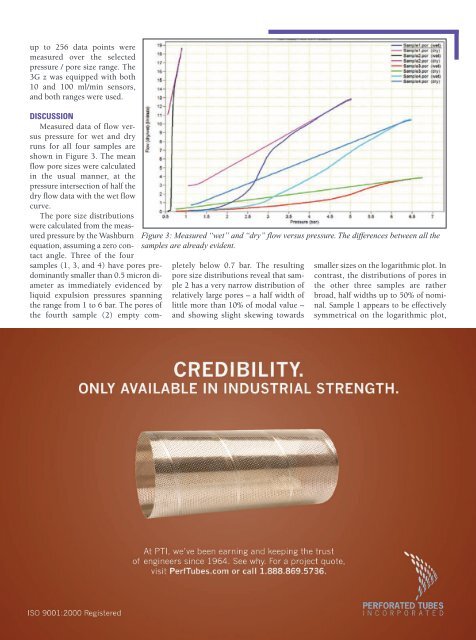
up to 256 data points weremeasured over the selectedpressure / pore size range. The3G z was equipped with both10 and 100 ml/min sensors,and both ranges were used.Figure 3: Measured “wet” and “dry” flow versus pressure. The differences between all thesamples are already evident.DISCUSSIONMeasured data of flow versuspressure for wet and dryruns for all four samples areshown in Figure 3. The meanflow pore sizes were calculatedin the usual manner, at thepressure intersection of half thedry flow data with the wet flowcurve.The pore size distributionswere calculated from the measuredpressure by the Washburnequation, assuming a zero contactangle. Three of the foursamples (1, 3, and 4) have pores predominantlysmaller than 0.5 micron diameteras immediately evidenced byliquid expulsion pressures spanningthe range from 1 to 6 bar. The pores ofthe fourth sample (2) empty completelybelow 0.7 bar. The resultingpore size distributions reveal that sample2 has a very narrow distribution ofrelatively large pores – a half width oflittle more than 10% of modal value –and showing slight skewing towardssmaller sizes on the logarithmic plot. Incontrast, the distributions of pores inthe other three samples are ratherbroad, half widths up to 50% of nominal.Sample 1 appears to be effectivelysymmetrical on the logarithmic plot,