Experimental determination and simulation of the angular ...
Experimental determination and simulation of the angular ...
Experimental determination and simulation of the angular ...

You also want an ePaper? Increase the reach of your titles
YUMPU automatically turns print PDFs into web optimized ePapers that Google loves.
IOP PUBLISHINGJOURNAL OF PHYSICS D: APPLIED PHYSICSJ. Phys. D: Appl. Phys. 43 (2010) 075302 (7pp) doi:10.1088/0022-3727/43/7/075302<strong>Experimental</strong> <strong>determination</strong> <strong>and</strong><strong>simulation</strong> <strong>of</strong> <strong>the</strong> <strong>angular</strong> distribution<strong>of</strong> <strong>the</strong> metal flux during magnetronsputter depositionM Horkel 1 , K Van Aeken 2 , C Eisenmenger-Sittner 1 , D Depla 2 , S Mahieu 2<strong>and</strong> W P Leroy 21 Institute <strong>of</strong> Solid State Physics, E-138, Vienna University <strong>of</strong> Technology, Wiedner Hauptstrasse 8-10,Vienna A-1040, Austria2 Department for Solid State Sciences, Ghent University, Krijgslaan 281 (S1) 9000, Ghent 9000, BelgiumE-mail: m.horkel@gmx.atReceived 9 September 2009, in final form 11 January 2010Published 5 February 2010Online at stacks.iop.org/JPhysD/43/075302AbstractTo underst<strong>and</strong> <strong>the</strong> film growth during magnetron sputter deposition a detailed knowledge <strong>of</strong><strong>the</strong> flux <strong>of</strong> sputtered species from <strong>the</strong> target towards <strong>the</strong> substrate is vital. One importantparameter is <strong>the</strong> <strong>angular</strong> distribution <strong>of</strong> <strong>the</strong> impinging neutral target atoms on <strong>the</strong> substrate,since it is responsible for, for example, self-shadowing effects. The <strong>determination</strong> <strong>of</strong> <strong>the</strong><strong>angular</strong> distribution <strong>of</strong> <strong>the</strong> metal flux at an arbitrary point in <strong>the</strong> deposition chamber isachieved by a pinhole camera, where <strong>the</strong> information <strong>of</strong> <strong>the</strong> <strong>angular</strong> distribution is convertedinto a thickness pr<strong>of</strong>ile. This paper describes <strong>the</strong> construction <strong>of</strong> such a pinhole camera whichis capable <strong>of</strong> differential pumping, <strong>the</strong> <strong>determination</strong> <strong>of</strong> <strong>the</strong> <strong>angular</strong> distribution for a widevariety <strong>of</strong> target materials, <strong>and</strong> which can easily be inserted into a deposition chamber. The<strong>angular</strong> distributions <strong>of</strong> different materials (Cu, W, Al, Ti, Mg) at different parameters(pressure, lateral position <strong>and</strong> vertical position) are experimentally determined <strong>and</strong> comparedwith <strong>simulation</strong>s obtained from a newly developed Monte Carlo code. It was also investigatedwhe<strong>the</strong>r parameters derived from <strong>the</strong> <strong>angular</strong> distribution are related to <strong>the</strong> degree <strong>of</strong><strong>the</strong>rmalization <strong>of</strong> <strong>the</strong> impinging particles.(Some figures in this article are in colour only in <strong>the</strong> electronic version)1. IntroductionThe <strong>angular</strong> distribution <strong>of</strong> <strong>the</strong> impinging neutral particlesduring magnetron sputtering, one <strong>of</strong> today’s most importantdeposition techniques, is an interesting parameter. First <strong>the</strong><strong>angular</strong> distribution may have a direct relationship with <strong>the</strong>properties <strong>of</strong> <strong>the</strong> deposited layers, e.g. <strong>the</strong> porosity <strong>of</strong> <strong>the</strong> filmcaused by self-shadowing effects [1, 2], mound formation [3],<strong>the</strong> step coverage in microelectronics [4] or <strong>the</strong> complex filmstructure caused by glancing angle deposition [5]. Besideits known influences, <strong>the</strong> <strong>angular</strong> distribution is an importantparameter for <strong>the</strong> <strong>simulation</strong> <strong>of</strong> film growth [6, 7]. In recentlydeveloped techniques such as <strong>the</strong> deposition <strong>of</strong> biaxiallyaligned layers [8, 9], <strong>the</strong> angle <strong>of</strong> <strong>the</strong> impinging atoms is evena vital parameter. Moreover, a detailed study <strong>of</strong> <strong>the</strong> <strong>angular</strong>distribution can provide insight into <strong>the</strong> fundamental principles<strong>of</strong> magnetron sputter deposition, such as <strong>the</strong> initial <strong>angular</strong>distribution <strong>of</strong> <strong>the</strong> sputtered particles, <strong>the</strong> shape <strong>of</strong> <strong>the</strong> localsputter rate <strong>and</strong> transport <strong>of</strong> <strong>the</strong> sputtered particles through<strong>the</strong> gas phase as all <strong>the</strong>se influence <strong>the</strong> <strong>angular</strong> distribution.In this context, a key aspect <strong>of</strong> magnetron sputter depositionis <strong>the</strong> energy <strong>of</strong> <strong>the</strong> particles arriving at <strong>the</strong> substrate whichis substantially higher than <strong>the</strong>rmal energy. Of course thislatter has its impact on <strong>the</strong> thin film growth [8, 9], <strong>and</strong>hence <strong>the</strong> degree <strong>of</strong> <strong>the</strong>rmalization <strong>of</strong> <strong>the</strong> arriving flux is animportant issue. As <strong>the</strong> <strong>angular</strong> distribution is influenced,0022-3727/10/075302+07$30.00 1 © 2010 IOP Publishing Ltd Printed in <strong>the</strong> UK
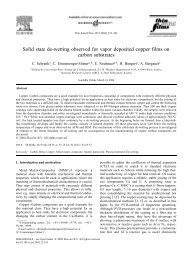
J. Phys. D: Appl. Phys. 43 (2010) 075302 M Horkel et alFigure 1. (a) Sketch <strong>of</strong> <strong>the</strong> working principle <strong>of</strong> <strong>the</strong> pinhole camera with a cylindrical substrate holder. (b) Picture <strong>of</strong> <strong>the</strong> MFM, indicatedparts are housing (1), pinhole (2), gasket (3), cylindrical substrate holder (4), cylindrical bracket (5), coated slide (6), measuring bar<strong>of</strong> 10 cm (7).toge<strong>the</strong>r with <strong>the</strong> energy <strong>of</strong> <strong>the</strong> particles, by <strong>the</strong> gas transport,measurements <strong>of</strong> <strong>the</strong> <strong>angular</strong> distribution can give insight into<strong>the</strong> <strong>the</strong>rmalization process.To measure <strong>the</strong> <strong>angular</strong> distribution <strong>of</strong> <strong>the</strong> impingingparticles, a device called metal flux monitor (MFM) has beenconstructed. It is a pinhole camera [10–15], which converts <strong>the</strong><strong>angular</strong> distribution <strong>of</strong> <strong>the</strong> arriving flux into a thickness pr<strong>of</strong>ile<strong>of</strong> a layer on a substrate behind a pinhole. This informationcan briefly be described as an image <strong>of</strong> <strong>the</strong> local sputter ratemultiplied by <strong>the</strong> initial <strong>angular</strong> distribution, which is <strong>the</strong>nblurred by gas phase scattering. One difference <strong>of</strong> <strong>the</strong> MFMfrom <strong>the</strong> pinhole cameras in <strong>the</strong> previous papers [12, 13] isthat it can be inserted via a load lock <strong>and</strong> is not fixedlymounted in <strong>the</strong> deposition chamber. This allows a swiftchange <strong>of</strong> <strong>the</strong> position <strong>of</strong> <strong>the</strong> MFM, <strong>and</strong> a high experimentalthroughput. The methods to analyse <strong>the</strong> thickness pr<strong>of</strong>iles werealso designed with respect to <strong>the</strong> high experimental throughput<strong>and</strong> allow a large variety <strong>of</strong> materials (not only metallic butalso transparent materials) to be measured. The experimentswere performed for various materials (Cu, W, Al, Mg, Ti)at different parameters (lateral position; distance magnetron-MFM; pressure), <strong>and</strong> <strong>the</strong> results are compared with <strong>simulation</strong>sby <strong>the</strong> Monte Carlo (MC) code SIMTRA [16].Section 2 <strong>of</strong> this paper describes <strong>the</strong> design <strong>of</strong> <strong>the</strong> MFM, itsfundamental principles <strong>and</strong> <strong>the</strong> <strong>determination</strong> <strong>of</strong> <strong>the</strong> thicknesspr<strong>of</strong>iles via optical methods. The experimental set-up <strong>and</strong>parameters are given in section 3, while section 4 gives abrief description <strong>of</strong> <strong>the</strong> MC-code SIMTRA. The experimentalresults in comparison with <strong>the</strong> <strong>simulation</strong>s performed bySIMTRA are presented in section 5. A relationship between<strong>the</strong> degree <strong>of</strong> <strong>the</strong>rmalization <strong>and</strong> <strong>the</strong> properties <strong>of</strong> <strong>the</strong> obtained<strong>angular</strong> distribution was studied.2. Metal flux monitorThe MFM is a pinhole camera which converts <strong>the</strong> information<strong>of</strong> <strong>the</strong> <strong>angular</strong> distribution <strong>of</strong> <strong>the</strong> metal flux at <strong>the</strong> position<strong>of</strong> <strong>the</strong> pinhole into a thickness pr<strong>of</strong>ile on <strong>the</strong> substrate, ei<strong>the</strong>rplanar or cylindrical, behind that pinhole. In this paper, <strong>the</strong>thickness pr<strong>of</strong>ile T(x)along a strip <strong>of</strong> approximately 0.5 mmis measured <strong>and</strong> converted into <strong>the</strong> <strong>angular</strong> flux (ϕ) <strong>of</strong>impinging particles at <strong>the</strong> pinhole site using equation (3). Theworking principle (in this case for a cylindrical substrate) isTable 1. Technical data MFM.Radius pinhole rLength pinhole dMaximum angle error ϕCover plate thicknessRadius cylindrical substrate holderDistance pinhole to planar substrateAcceptance angle cylindricalAcceptance angle planar0.5 mm0.2 mm2.9 ◦2 mm10 mm10 mm75 ◦45 ◦sketched in figure 1(a). It is a sealed (except <strong>the</strong> pinhole)cylindrical chamber (figure 1(b)) connected to a stainless steelpipe with a KF40 linear feed-through.There is a MFM with <strong>the</strong> pinhole directed perpendicularto <strong>the</strong> feed-through axis (figure 1(b)), which can hold acylindrical or a planar substrate holder, <strong>and</strong> one with <strong>the</strong>pinhole directed parallel to <strong>the</strong> feed-through axis, which canonly hold a planar substrate holder.The direct connection <strong>of</strong> <strong>the</strong> MFM to a pipe <strong>and</strong> a linearfeed-through enhances its flexibility, as it can be mounted intoevery deposition chamber with a KF40 flange, <strong>and</strong> its positioncan be changed quickly. It also enables differential pumping<strong>of</strong> <strong>the</strong> MFM via <strong>the</strong> pipe (to increase <strong>the</strong> mean free path <strong>of</strong>particles inside <strong>the</strong> MFM), <strong>and</strong> <strong>the</strong> inlet <strong>of</strong> reactants directlyinto <strong>the</strong> MFM from outside <strong>the</strong> recipient. Some important dataare given in table 1.To convert <strong>the</strong> thickness pr<strong>of</strong>ile T(x)on <strong>the</strong> substrate into<strong>the</strong> <strong>angular</strong> flux (ϕ) <strong>of</strong> impinging particles at <strong>the</strong> pinhole site,one has to take into account <strong>the</strong> geometry <strong>of</strong> <strong>the</strong> pinhole. Theeffective area <strong>of</strong> <strong>the</strong> pinhole decreases with increasing angle, aneffect called vignetting (V(ϕ))(figure 2), thus also decreasing<strong>the</strong> number <strong>of</strong> passing particles.For a cylindrical pinhole (length d; radius r) V(ϕ) isdescribed as <strong>the</strong> ratio <strong>of</strong> effective area A eff seen by <strong>the</strong> tiltedbeam to <strong>the</strong> area <strong>of</strong> <strong>the</strong> pinhole A 0 . V(ϕ)can be expressed as[V(ϕ)= A ( )eff 2 cos (ϕ) π d tan (|ϕ|)=A 0 π 2 − arcsin 2r⎛ √⎞( ) ]− ⎝d tan (|ϕ|) d tan (|ϕ|) 21 −⎠ . (1)2r2r2
J. Phys. D: Appl. Phys. 43 (2010) 075302 M Horkel et alFigure 3. Grey scale image (green channel) <strong>of</strong> a scanned sample(Cu deposited on a flexible <strong>and</strong> transparent substrate).Figure 2. Vignetting: two particles are entering <strong>the</strong> MFM atdifferent angles ϕ; one perpendicular (ϕ = 0 ◦ ; aperture A 0 <strong>of</strong> r 2 π)<strong>and</strong> <strong>the</strong> second one at an angle ϕ 2 with a smaller aperture <strong>of</strong> A eff .The angle error ϕ decreases at higher angles because <strong>of</strong> <strong>the</strong>decreasing aperture.For a substrate <strong>of</strong> cylindrical shape, T(x)can be converted into(ϕ) according to(ϕ) ∝ T (x(ϕ)) . (2)V(ϕ)Aside from cylindrical substrates, also planar substrates wereused. They were necessary, since <strong>the</strong> flexible substrates neededfor <strong>the</strong> cylindrical substrate holder prohibit certain surfaceanalysis techniques (e.g. thickness pr<strong>of</strong>ile <strong>determination</strong> <strong>of</strong>oxides; see below). Compared with <strong>the</strong> cylindrical substrate,planar substrates do have <strong>the</strong> disadvantage that <strong>the</strong> distancebetween pinhole <strong>and</strong> substrate is angle dependent, <strong>and</strong> that <strong>the</strong>incidence angle on <strong>the</strong> substrate is not perpendicular anymore.For planar substrates T(x) can be converted into (ϕ)according toT (x(ϕ))(ϕ) ∝V(ϕ)· cos 3 (ϕ) . (3)The resolution <strong>of</strong> <strong>the</strong> MFM is limited by two effects; one is <strong>the</strong><strong>angular</strong> error ϕ caused by <strong>the</strong> aperture (figure 2), <strong>the</strong> o<strong>the</strong>ris gas phase scattering inside <strong>the</strong> MFM, which can be loweredby differential pumping <strong>of</strong> <strong>the</strong> MFM.Ano<strong>the</strong>r limiting factor might be that only those particleswhich stick contribute to film growth <strong>and</strong> can <strong>the</strong>refore bemeasured. The sticking probability is determined by energy<strong>and</strong> incidence angle [17]. For <strong>the</strong> cylindrically shapedsubstrate <strong>the</strong> incidence angle is always perpendicular, <strong>the</strong>refore<strong>the</strong> sticking probability can be assumed to be 1, even at higherenergies. As mentioned above, <strong>the</strong> incidence angle on <strong>the</strong>planar substrate is not perpendicular. However, <strong>the</strong> stickingprobability becomes angle dependent at higher angles (above45 ◦ , which is <strong>the</strong> maximum acceptance angle <strong>of</strong> <strong>the</strong> MFM).Moreover, in <strong>the</strong> described experiments <strong>the</strong> particles whichare not scattered, <strong>and</strong> <strong>the</strong>refore have higher energies, typicallyhave incidence angles <strong>of</strong> 20 ◦ <strong>and</strong> below. Therefore, even for<strong>the</strong> planar substrate <strong>the</strong> sticking coefficient can be assumedto be 1.Due to <strong>the</strong> pinhole geometry, <strong>the</strong> deposition rate on <strong>the</strong>substrate is drastically reduced (by a factor <strong>of</strong> approximately0.01 <strong>and</strong> lower), thus increasing problems with residual gasincorporation. The reason is that <strong>the</strong> ratio <strong>of</strong> <strong>the</strong> impingementrates <strong>of</strong> <strong>the</strong> residual gas molecules v g [18] <strong>and</strong> <strong>of</strong> <strong>the</strong> sputteredparticles v d , given in (4), increases with decreasing depositionrate.v gv d=m d · pa w ρ √ 2πm g k B T , (4)where p is <strong>the</strong> residual gas pressure (Pa), m g is <strong>the</strong> molecularor atomic mass <strong>of</strong> <strong>the</strong> residual gas (kg), m d is <strong>the</strong> molecular oratomic mass <strong>of</strong> <strong>the</strong> sputtered material (kg), k B is <strong>the</strong> Boltzmannconstant (1.38 × 10 −23 JK −1 ), T is <strong>the</strong> temperature (K), a w is<strong>the</strong> deposition rate (m s −1 ) <strong>and</strong> ρ is <strong>the</strong> density <strong>of</strong> depositedmaterial (kg m −3 ).If one assumes a residual oxygen pressure <strong>of</strong> 10 −5 Pa <strong>and</strong>a deposition rate <strong>of</strong> 5 × 10 −12 ms −1 <strong>of</strong> Al inside <strong>the</strong> MFM<strong>the</strong> ratio v g /v d would be approximately 1. Knowing that<strong>the</strong> oxygen incorporation coefficient during sputter deposition<strong>of</strong> reactive metals such as Al <strong>and</strong> Mg can reach values upto 0.1–0.25 [19, 20], <strong>the</strong> formation <strong>of</strong> oxide layers seemsunavoidable, even for a low residual gas pressure.The thickness pr<strong>of</strong>iles on <strong>the</strong> substrates were determinedvia optical methods. For metallic layers <strong>the</strong> thickness wasdensitometrically determined via an optical scanner, as in <strong>the</strong>previous papers [12, 13]. The transmissivity (figure 3) <strong>of</strong><strong>the</strong> metallic layers was spatially resolved by a transmissionscanner (Reflecta CrystalScan 7200) <strong>and</strong> <strong>the</strong> transmissivity <strong>of</strong><strong>the</strong> coated substrates was compared with that <strong>of</strong> an uncoatedsubstrate. With <strong>the</strong> known transmissivity, <strong>the</strong> thickness <strong>of</strong> eachpoint <strong>of</strong> <strong>the</strong> pr<strong>of</strong>ile can be determined.The thickness pr<strong>of</strong>iles <strong>of</strong> <strong>the</strong> oxide layers were determinedvia a spatially resolved interferometric method especiallydesigned for this task, where <strong>the</strong> oxide layer is depositedon a reflective substrate (e.g. polished silicon wafer) <strong>and</strong>its interference patterns are captured by a digital camera(figure 4(a)). The image is <strong>the</strong>n colour split (figures 4(b)–(d))<strong>and</strong> <strong>the</strong> pr<strong>of</strong>ile determined for each colour individually(assuming a two beam interference). These three pr<strong>of</strong>iles are<strong>the</strong>n averaged. For <strong>the</strong> interferometric method an OlympusStylus 760 was used as digital camera.3. <strong>Experimental</strong>The experimental set-up is depicted in figure 5. Experimentswere performed in different vacuum chambers with basepressures <strong>of</strong> about 10 −5 Pa. A planar disc shaped magnetronsource with a target diameter <strong>of</strong> 100 mm was used. Thedistance <strong>of</strong> <strong>the</strong> target centre to <strong>the</strong> area with <strong>the</strong> highestlocal sputter rate, called <strong>the</strong> racetrack, was 23 mm. Angular3
J. Phys. D: Appl. Phys. 43 (2010) 075302 M Horkel et alFigure 4. (a) Image <strong>of</strong> a sample (Al deposited on polished silicon wafer) captured by a digital camera. Grey scale images <strong>of</strong> <strong>the</strong> (b) blue;(c) green; (d) red colour channel. The interference patterns are clearly visible.Table 2. Parameters <strong>of</strong> <strong>the</strong> experiments.Pressures (Pa) x-positions (mm)Material (x = 0; z = 95 mm) (p = 0.5Pa,z = 95 mm)Cu 0.3; 0.5; 0.7; 1; 3 0; 11; 23; 35W 0.3; 0.5; 0.7; 1; 3Al 0.3; 0.5; 0.7; 1 0; 11; 23; 35Mg 0.1; 0.3; 0.5; 0.7; 1 0; 11; 23; 35Ti 0.3; 0.5; 0.7; 1 0; 11; 23; 35z-distances (mm) (eccentricity x = 5 mm; p = 0.5Pa)Cu 25; 50; 95; 125; 150Figure 5. <strong>Experimental</strong> set-up: vacuum chamber (1), MFM (withplanar substrate) movable in <strong>the</strong> x-axis (2), MFM (with planarsubstrate) movable in <strong>the</strong> z-axis (3), target <strong>and</strong> origin <strong>of</strong>coordinates in its centre (4), load-lock chamber (5), linearfeed-through for KF40 flange (6), pipe <strong>of</strong> <strong>the</strong> MFM leading outside<strong>the</strong> chamber, used for differential pumping <strong>and</strong> inlet <strong>of</strong> gas into <strong>the</strong>MFM (7).measurements were carried out for W, Cu, Ti, Al <strong>and</strong> Mgtargets sputtered with Ar as working gas (inlet via a needlevalve or a mass flow controller). Experiments were carriedout for different pressures with <strong>the</strong> monitor mounted 95 mmcentrally above <strong>the</strong> target, <strong>and</strong> also at a constant pressure <strong>of</strong>0.5 Pa for different lateral (x-positions) <strong>and</strong> target substrate (z)distances. For <strong>the</strong> experiments with a different z-distance asmall eccentricity <strong>of</strong> 5 mm was experimentally unavoidable,because <strong>the</strong> load lock was not right opposite <strong>the</strong> magnetron.A summary <strong>of</strong> <strong>the</strong> experimental parameters is given in table 2.The magnetron was operated at a constant dc dischargecurrent <strong>of</strong> 0.3 A (experiments with variable pressure <strong>and</strong> lateralposition) <strong>and</strong> 0.9 A (experiments with variable distance). Cu<strong>and</strong> W were deposited as metallic layers using <strong>the</strong> cylindricalsubstrate holder with transparent slides as substrates. Al<strong>and</strong> Mg were completely oxidized by <strong>the</strong> residual gas <strong>and</strong>were <strong>the</strong>refore deposited on silicon wafers in <strong>the</strong> planarsubstrate holder, to enable <strong>the</strong> pr<strong>of</strong>ile <strong>determination</strong> via <strong>the</strong>interferometric method. Ti was only partially oxidized by <strong>the</strong>residual gas, hence a very small amount <strong>of</strong> oxygen was inserteddirectly into <strong>the</strong> MFM (without influencing <strong>the</strong> sputteringprocess) to form an oxide layer, o<strong>the</strong>rwise it was treated likeAl <strong>and</strong> Mg. Although <strong>the</strong> maximum acceptance angle <strong>of</strong> <strong>the</strong>cylindrical substrate is 75 ◦ , <strong>the</strong> experimental pr<strong>of</strong>iles were cut<strong>of</strong>fat45 ◦ , because <strong>the</strong> signal to noise ratio becomes large athigher angles.4. SimulationsThe metal flux towards <strong>the</strong> flux monitor was simulated using<strong>the</strong> MC-code SIMTRA [16], which tracks a representative set<strong>of</strong> individual particles in <strong>the</strong>ir movement through <strong>the</strong> vacuumchamber. By its working principle, first a sputtered particle isgenerated with initial position, energy <strong>and</strong> direction, sampledfrom given distribution functions. Here <strong>the</strong> ejection positionswere taken from a measured erosion pr<strong>of</strong>ile, neglecting <strong>the</strong>small influence <strong>of</strong> <strong>the</strong> target material on <strong>the</strong> racetrack shape.The initial energy distribution resulted from <strong>simulation</strong>s using<strong>the</strong> binary collision code SRIM [21] with a constant incidention energy corresponding to 75% <strong>of</strong> <strong>the</strong> discharge voltage[22, 23]. Although SRIM also provides <strong>the</strong> initial <strong>angular</strong>distributions, <strong>the</strong>se did not take <strong>the</strong> typical heart-like shapeobserved experimentally [24–28]. Hence, as was described4
J. Phys. D: Appl. Phys. 43 (2010) 075302 M Horkel et alFigure 6. Angular distribution (ϕ) <strong>of</strong> <strong>the</strong> metal flux at a substrate 95 mm above <strong>the</strong> target surface as a function <strong>of</strong> <strong>the</strong> discharge pressurefor (a) W,(b) Cu, (c) Ti, (d) Al . For W <strong>the</strong> <strong>angular</strong> distribution at p = 0 Pa (no gas phase scattering) is also shown. The <strong>angular</strong>distributions have local minimum at <strong>the</strong> centre (ϕ = 0, value R min ), <strong>and</strong> a maximum at <strong>the</strong> racetracks (value: R max ).in [16], initial <strong>angular</strong> distributions for Cu, Al <strong>and</strong> Ti wereinstead reconstructed from deposition measurements, using<strong>the</strong> transport code in a reverse way. For W <strong>and</strong> Mg, on <strong>the</strong>o<strong>the</strong>r h<strong>and</strong>, having no data available, <strong>the</strong> SRIM initial <strong>angular</strong>distributions were used. However, considering <strong>the</strong> geometry<strong>of</strong> <strong>the</strong> experimental set-up, this parameter was expected <strong>and</strong>found to have a limited influence.In <strong>the</strong> next step <strong>of</strong> <strong>the</strong> model <strong>the</strong> collisional transport <strong>of</strong><strong>the</strong> sputtered particle through <strong>the</strong> gas phase is described. Thebackground gas was assumed homogeneous at temperatureT = 350 K <strong>and</strong> specified pressure p. The assumption<strong>of</strong> an homogeneous temperature distribution is valid, since<strong>the</strong> heating <strong>of</strong> <strong>the</strong> gas [29] <strong>and</strong> gas rarefaction [30, 31]are negligible at pressures below 1 Pa. Collisions weremodelled based on ei<strong>the</strong>r quantum chemical (Cu–Ar, Al–Ar[32]) or screened Coulomb interaction potentials. Also <strong>the</strong><strong>the</strong>rmal motion <strong>of</strong> <strong>the</strong> background gas atoms was included.The sticking coefficient at <strong>the</strong> substrate was assumed tobe unity.The simulated configuration mimicked <strong>the</strong> experimentalset-up, including <strong>the</strong> inside <strong>of</strong> <strong>the</strong> MFM. The <strong>angular</strong>distribution can be directly constructed from <strong>the</strong> particlesarriving at <strong>the</strong> pinhole. By continuing to track <strong>the</strong> particlesthrough <strong>the</strong> MFM <strong>and</strong> following <strong>the</strong> experimental procedure,i.e. calculation <strong>of</strong> <strong>the</strong> deposition pr<strong>of</strong>ile <strong>and</strong> applying vignettingcorrection, it is possible to gauge <strong>the</strong> influence <strong>of</strong> scattering in<strong>the</strong> flux monitor <strong>and</strong> <strong>the</strong> <strong>angular</strong> error due to <strong>the</strong> aperture.5. Results <strong>and</strong> discussionThe influence <strong>of</strong> <strong>the</strong> deposition pressure on <strong>the</strong> <strong>angular</strong>distribution (ϕ) at a substrate positioned at z = 95 mm<strong>and</strong> x = 0 mm (central above <strong>the</strong> target) is shown infigures 6(a)–(d) for W, Cu, Ti <strong>and</strong> Al, respectively. Thecalculated <strong>angular</strong> distribution with neglected gas phasescattering (p = 0 Pa) is plotted for W. Clearly visible in figure 6is <strong>the</strong> broadening <strong>of</strong> <strong>the</strong> <strong>angular</strong> distribution with increasingpressure, reproduced well by <strong>the</strong> SIMTRA <strong>simulation</strong>s. Withsome exceptions this is also <strong>the</strong> trend observed in <strong>the</strong> materialdependence. The lighter elements are averagely scattered overlarger angles, leading to an increase in <strong>the</strong> fraction <strong>of</strong> <strong>the</strong>flux arriving at higher incident angles. A good parameter toquantify <strong>the</strong> amount <strong>of</strong> gas scattering is <strong>the</strong> ratio R min /R max <strong>of</strong><strong>the</strong> local minimum in <strong>the</strong> centre <strong>of</strong> <strong>the</strong> target <strong>and</strong> <strong>the</strong> maximumat <strong>the</strong> racetracks (indicated in figure 6(a) for 0.3 Pa). Since(ϕ) is symmetrical in this case, because <strong>the</strong> MFM is centrallyabove <strong>the</strong> target, <strong>the</strong> results are plotted from ϕ = 0 ◦ to ϕ = 45 ◦The influence <strong>of</strong> gas phase scattering inside <strong>the</strong> MFM wasinvestigated with <strong>simulation</strong>s. Scattering inside <strong>the</strong> monitorbroadens <strong>the</strong> <strong>angular</strong> pr<strong>of</strong>ile somewhat, although <strong>the</strong> effectis limited at all pressures. At low pressure <strong>the</strong> arrivingflux is directional, but <strong>the</strong> scattering probability remains lowso <strong>the</strong> pr<strong>of</strong>iles stay relatively intact. At higher pressure<strong>simulation</strong>s showed significant scattering in <strong>the</strong> monitor, butdue to scattering in <strong>the</strong> vacuum chamber, <strong>the</strong> arriving flux at5
J. Phys. D: Appl. Phys. 43 (2010) 075302 M Horkel et alFigure 7. Angular distribution (ϕ) <strong>of</strong> <strong>the</strong> metal flux at a substrate95 mm above <strong>the</strong> target surface as a function <strong>of</strong> <strong>the</strong> x(lateral)-position for Cu sputtered at a pressure <strong>of</strong> 0.5 Pa.Figure 9. Comparison between R min /R max (observed) <strong>and</strong> P <strong>the</strong>rm(calculated) for all investigated target materials at differentdeposition pressures <strong>and</strong> for Cu with variable distances.<strong>and</strong> Valles-Abarca [33] asP <strong>the</strong>rm (5). The analytical model <strong>of</strong><strong>the</strong> calculation assumed a continuous slowing down <strong>of</strong> particlesalong straight line trajectories with a velocity proportionalenergy loss per unit path length.Figure 8. Angular distribution <strong>of</strong> copper as a function <strong>of</strong> <strong>the</strong>distance z <strong>of</strong> <strong>the</strong> substrate from <strong>the</strong> target. Conditions werep = 0.5Pa,x = 0.5 mm (eccentricity).<strong>the</strong> pinhole is already r<strong>and</strong>omized to such a degree that <strong>the</strong>extra scattering in <strong>the</strong> monitor only has a limited influenceon <strong>the</strong> resulting deposition pr<strong>of</strong>ile. This indicates that, evenwithout differential pumping, <strong>the</strong> flux monitor allows accuratemeasurements <strong>of</strong> <strong>the</strong> arriving <strong>angular</strong> distribution.Figure 7 shows <strong>the</strong> influence <strong>of</strong> <strong>the</strong> x (lateral) positionon <strong>the</strong> <strong>angular</strong> distribution <strong>of</strong> <strong>the</strong> arriving metal flux for Cuas example. The <strong>angular</strong> distribution shifts <strong>and</strong> becomesasymmetric. Although <strong>the</strong> effect is mainly geometrical, anaccurate quantification can help in improving for instance<strong>the</strong> uniformity <strong>of</strong> films deposited under conditions where <strong>the</strong>arriving <strong>angular</strong> distribution influences <strong>the</strong> microstructure.The results <strong>of</strong> <strong>the</strong> series with different z-distances (ata constant lateral eccentricity x = 5 mm) are shown infigure 8 with <strong>the</strong> MC-<strong>simulation</strong> for comparison. As expectedR min /R max increases with <strong>the</strong> distance. Since <strong>the</strong> distributionsare not symmetrical, due to <strong>the</strong> eccentricity, <strong>the</strong> results areplotted from −45 ◦ to +45 ◦ .Due to collisions with <strong>the</strong> working gas, <strong>the</strong> sputteredparticles will lose energy <strong>and</strong> direction. Hence, due tocollisions, <strong>the</strong> sputtered particles will get more <strong>and</strong> more<strong>the</strong>rmalized. This degree <strong>of</strong> <strong>the</strong>rmalization (<strong>the</strong> point where<strong>the</strong> sputtered particles can be treated as a Maxwellian gas, i.e.<strong>the</strong>rmal energy <strong>and</strong> r<strong>and</strong>om direction) was given by Gras-Martix 2P <strong>the</strong>rm =R(U) 2 + x , (5)2where x is <strong>the</strong> distance target-MFM, R(U)(6) is <strong>the</strong> path length<strong>of</strong> a particle with initial energy U (surface binding energy) until<strong>the</strong>rmalization is reached.R(U) = A · U 1/2 . (6)The energy independent coefficient A is given byA ∼ = 0.012 (Mg1/2 1+ 1 ) 1/2(1+µ2/3 ) 3/4 T (K)µp(Pa)withµ = M g /M swhere M g is <strong>the</strong> mass <strong>of</strong> gas (amu), M s is <strong>the</strong> mass <strong>of</strong> targetmaterial (amu), T is <strong>the</strong> temperature (300 K) <strong>and</strong> U is <strong>the</strong>surface binding energy (eV).This probability <strong>of</strong> <strong>the</strong>rmalization P <strong>the</strong>rm can be comparedwith <strong>the</strong> ratio R min /R max <strong>of</strong> <strong>the</strong> local minimum in <strong>the</strong> centre<strong>of</strong> <strong>the</strong> target <strong>and</strong> <strong>the</strong> maximum at <strong>the</strong> racetracks (indicatedin figure 6(a)). Indeed, <strong>the</strong> flux in <strong>the</strong> centre should bezero when <strong>the</strong>re is no gas scattering (R min /R max = 0) <strong>and</strong>should be maximal when <strong>the</strong>re is a lot <strong>of</strong> gas phase scattering(R min /R max = 1). This relation between P <strong>the</strong>rm <strong>and</strong> R min /R maxis shown in figure 9. It can be concluded that <strong>the</strong> MFMallows measuring <strong>the</strong> degree <strong>of</strong> <strong>the</strong>rmalization <strong>of</strong> <strong>the</strong> sputteredparticles.6. ConclusionsThe MFM allows measurement <strong>of</strong> <strong>the</strong> <strong>angular</strong> distribution<strong>of</strong> <strong>the</strong> metal flux. Also information on <strong>the</strong> number <strong>of</strong>(7)6
J. Phys. D: Appl. Phys. 43 (2010) 075302 M Horkel et al<strong>the</strong>rmalized neutrals can be obtained from <strong>the</strong> measured<strong>angular</strong> distribution. The different methods presented forthickness <strong>determination</strong> with a good lateral resolution allow<strong>the</strong> MFM to be used for a wide variety <strong>of</strong> target materials.It was demonstrated that (ϕ) is not isotropic for <strong>the</strong> usualdeposition parameters. The experimentally obtained resultswere compared with <strong>simulation</strong>s <strong>and</strong> a good match was found.It was also shown that <strong>the</strong> ratio R min /R max is correlated with<strong>the</strong> degree <strong>of</strong> <strong>the</strong>rmalization <strong>of</strong> <strong>the</strong> metal flux. Therefore <strong>the</strong>degree <strong>of</strong> <strong>the</strong>rmalization can be estimated for given processparameters with one measurement.AcknowledgmentsThis work was supported by <strong>the</strong> Institute for <strong>the</strong> Promotion<strong>of</strong> Innovation by Science <strong>and</strong> Technology in Fl<strong>and</strong>ers (IWT)under Grant No SBO-060030.References[1] Bales G S, Bruinsma R, Eklund E A, Karunasiri RPU,Rudnick J <strong>and</strong> Zangwill A 1990 Science 249 264–8[2] Bales G S <strong>and</strong> Zangwill A 1991 J. Vac. Sci. Technol. A9 145–149[3] Pelliccione M, Karabacak T, Gaire C, Wang GC<strong>and</strong>LuTM2006 Phys. Rev. B 74 125420[4] Blech I A <strong>and</strong> V<strong>and</strong>er Plas H A 1983 J. Appl. Phys. 54 3489–96[5] Robbie K <strong>and</strong> Brett M J 1997 J. Vac. Sci. Technol. A15 1460–65[6] Lugscheider E <strong>and</strong> von Hayn G 1999 Surf. Coat. Technol.116–119 568–72[7] Wang L <strong>and</strong> Clancy P 2001 Surf. Sci. 473 25–38[8] Mahieu S, Ghekiere P, Depla D <strong>and</strong> De Gryse R 2006Thin Solid Films 515 1229–49[9] Mahieu S, Ghekiere P, Dewinter G, De Gryse R, Depla D <strong>and</strong>Lebedev O I 2005 Solid State Phenom. 105 447–52[10] Thornton J A <strong>and</strong> H<strong>of</strong>fman D W 1981 J. Vac. Sci. Technol.18 203–7[11] Swan S 1987 J. Vac. Sci. Technol. A 5 1750–4[12] Eisenmenger C, Bergauer A, Bangert H <strong>and</strong> Bauer W 1994J. Vac. Sci. Technol. A 12 536–41[13] Eisenmenger C, Beyerknecht R, Bergauer A, Bauer W <strong>and</strong>Betz G 1995 J. Vac. Sci. Technol. A 13 2435–43[14] Feddes B, WolkeJGC,Jansen J A <strong>and</strong> Vredenberg A M 2003J. Appl. Phys. 93 662–70[15] Panjan M, Cremer R, Fuss H G, Panjan P <strong>and</strong> Cekada M 2010The use <strong>of</strong> camera obscura in sputter deposition Vacuum84 45–48[16] Van Aeken K, Mahieu S <strong>and</strong> Depla D 2008 J. Phys. D: Appl.Phys. 41 205307[17] Zhou X W <strong>and</strong> Wadley HNG1999 Surf. Sci. 431 58–73[18] Maissel L <strong>and</strong> Glang R 1970 H<strong>and</strong>book <strong>of</strong> Thin FilmTechnology (New York: McGraw-Hill) pp 1–21, ISBN978-0070397422[19] Leroy W P, Mahieu S, Persoons R <strong>and</strong> Depla D 2009 PlasmaProcess. Polym. 6 s342–s346[20] Leroy W P, Mahieu S, Persoons R <strong>and</strong> Depla D 2009 ThinSolid Films 518 1527–31[21] The Stopping <strong>and</strong> Range <strong>of</strong> Ions in Matter 2006 available athttp://www.srim.org/[22] Czekaj D, Goranchev B, Hollmann E K, Volpyas VA<strong>and</strong>Zaytsev A G 1991 Vacuum 42 43[23] Goeckner M J, Goree J A <strong>and</strong> SheridanT E 1991 IEEE Trans.Plasma Sci. 19 301[24] Ramos R, Cunge G, Touzeau M <strong>and</strong> Sadeghi N 2008 J. Phys.D: Appl. Phys. 41 152003[25] Yamamura Y <strong>and</strong> Ishida M 1995 J. Vac. Sci. Technol. A 13 101[26] Goehlich A, Gillman D <strong>and</strong> Döbele H F 2001 Nucl. Instrum.Methods Phys. Res. B 179 351[27] Yamamura Y 1982 Nucl. Instrum. Methods 194 515[28] Tondu T 2005 PhD Thesis SUPAERO Engineering School,Toulouse, France[29] Depla D <strong>and</strong> Mahieu S 2008 Reactive Sputter Deposition(Berlin: Springer) pp 120, ISBN 978-3540766629[30] Palmero A, Rudolph H <strong>and</strong> Habraken FHPM2006Appl. Phys. Lett. 89 211501[31] Palmero A, Rudolph H <strong>and</strong> Habraken FHPM2007 J. Appl.Phys. 101 083307[32] Kuwata K T, Erickson R I <strong>and</strong> Doyle J R 2003 Nucl. Instrum.Methods Phys. Res. B 201 566–570[33] Gras-Marti A <strong>and</strong> Valles-Abarca J A 1983 J. Appl. Phys.54 1071–757