Journal of - Southern University New Orleans
Journal of - Southern University New Orleans
Journal of - Southern University New Orleans
- No tags were found...
You also want an ePaper? Increase the reach of your titles
YUMPU automatically turns print PDFs into web optimized ePapers that Google loves.
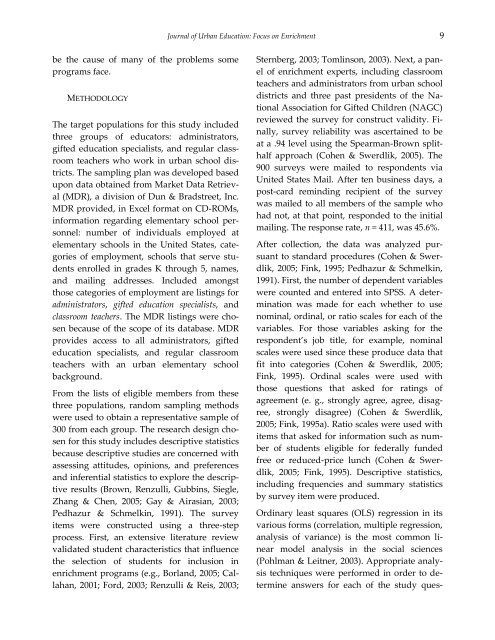
<strong>Journal</strong> <strong>of</strong> Urban Education: Focus on Enrichment 9be the cause <strong>of</strong> many <strong>of</strong> the problems someprograms face.METHODOLOGYThe target populations for this study includedthree groups <strong>of</strong> educators: administrators,gifted education specialists, and regular classroomteachers who work in urban school districts.The sampling plan was developed basedupon data obtained from Market Data Retrieval(MDR), a division <strong>of</strong> Dun & Bradstreet, Inc.MDR provided, in Excel format on CD-ROMs,information regarding elementary school personnel:number <strong>of</strong> individuals employed atelementary schools in the United States, categories<strong>of</strong> employment, schools that serve studentsenrolled in grades K through 5, names,and mailing addresses. Included amongstthose categories <strong>of</strong> employment are listings foradministrators, gifted education specialists, andclassroom teachers. The MDR listings were chosenbecause <strong>of</strong> the scope <strong>of</strong> its database. MDRprovides access to all administrators, giftededucation specialists, and regular classroomteachers with an urban elementary schoolbackground.From the lists <strong>of</strong> eligible members from thesethree populations, random sampling methodswere used to obtain a representative sample <strong>of</strong>300 from each group. The research design chosenfor this study includes descriptive statisticsbecause descriptive studies are concerned withassessing attitudes, opinions, and preferencesand inferential statistics to explore the descriptiveresults (Brown, Renzulli, Gubbins, Siegle,Zhang & Chen, 2005; Gay & Airasian, 2003;Pedhazur & Schmelkin, 1991). The surveyitems were constructed using a three-stepprocess. First, an extensive literature reviewvalidated student characteristics that influencethe selection <strong>of</strong> students for inclusion inenrichment programs (e.g., Borland, 2005; Callahan,2001; Ford, 2003; Renzulli & Reis, 2003;Sternberg, 2003; Tomlinson, 2003). Next, a panel<strong>of</strong> enrichment experts, including classroomteachers and administrators from urban schooldistricts and three past presidents <strong>of</strong> the NationalAssociation for Gifted Children (NAGC)reviewed the survey for construct validity. Finally,survey reliability was ascertained to beat a .94 level using the Spearman-Brown splithalfapproach (Cohen & Swerdlik, 2005). The900 surveys were mailed to respondents viaUnited States Mail. After ten business days, apost-card reminding recipient <strong>of</strong> the surveywas mailed to all members <strong>of</strong> the sample whohad not, at that point, responded to the initialmailing. The response rate, n = 411, was 45.6%.After collection, the data was analyzed pursuantto standard procedures (Cohen & Swerdlik,2005; Fink, 1995; Pedhazur & Schmelkin,1991). First, the number <strong>of</strong> dependent variableswere counted and entered into SPSS. A determinationwas made for each whether to usenominal, ordinal, or ratio scales for each <strong>of</strong> thevariables. For those variables asking for therespondent’s job title, for example, nominalscales were used since these produce data thatfit into categories (Cohen & Swerdlik, 2005;Fink, 1995). Ordinal scales were used withthose questions that asked for ratings <strong>of</strong>agreement (e. g., strongly agree, agree, disagree,strongly disagree) (Cohen & Swerdlik,2005; Fink, 1995a). Ratio scales were used withitems that asked for information such as number<strong>of</strong> students eligible for federally fundedfree or reduced-price lunch (Cohen & Swerdlik,2005; Fink, 1995). Descriptive statistics,including frequencies and summary statisticsby survey item were produced.Ordinary least squares (OLS) regression in itsvarious forms (correlation, multiple regression,analysis <strong>of</strong> variance) is the most common linearmodel analysis in the social sciences(Pohlman & Leitner, 2003). Appropriate analysistechniques were performed in order to determineanswers for each <strong>of</strong> the study ques-


