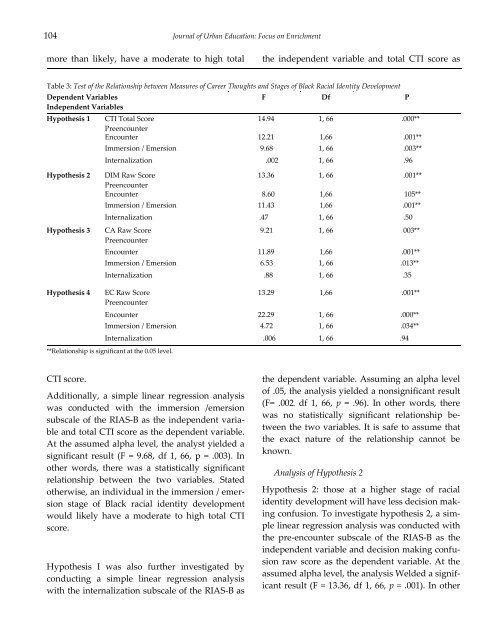
104 <strong>Journal</strong> <strong>of</strong> Urban Education: Focus on Enrichmentmore than likely, have a moderate to high totalthe independent variable and total CTI score asTable 3: Test <strong>of</strong> the Relationship between Measures <strong>of</strong> Career Thoughts and Stages <strong>of</strong> Black Racial Identity DevelopmentDependent VariablesIndependent VariablesHypothesis 1F Df PCTI Total Score14.94 1, 66 .000**PreencounterEncounter 12.21 1,66 .001**Immersion / Emersion 9.68 1, 66 .003**Internalization .002 1, 66 .96Hypothesis 2Hypothesis 3DIM Raw Score13.36 1, 66 .001**PreencounterEncounter 8.60 1,66 105**Immersion / Emersion 11.43 1,66 .001**Internalization .47 1, 66 .50CA Raw ScorePreencounter9.21 1, 66 003**Encounter 11.89 1,66 .001**Immersion / Emersion 6.53 1, 66 .013**Internalization .88 1, 66 .35Hypothesis 4EC Raw ScorePreencounter13.29 1,66 .001**Encounter 22.29 1, 66 .000**Immersion / Emersion 4.72 1, 66 .034**Internalization .006 1, 66 .94**Relationship is significant at the 0.05 level.CTI score.Additionally, a simple linear regression analysiswas conducted with the immersion /emersionsubscale <strong>of</strong> the RIAS-B as the independent variableand total CTI score as the dependent variable.At the assumed alpha level, the analyst yielded asignificant result (F = 9.68, df 1, 66, p = .003). Inother words, there was a statistically significantrelationship between the two variables. Statedotherwise, an individual in the immersion / emersionstage <strong>of</strong> Black racial identity developmentwould likely have a moderate to high total CTIscore.Hypothesis I was also further investigated byconducting a simple linear regression analysiswith the internalization subscale <strong>of</strong> the RIAS-B asthe dependent variable. Assuming an alpha level<strong>of</strong> .05, the analysis yielded a nonsignificant result(F= .002, df 1, 66, p = .96). In other words, therewas no statistically significant relationship betweenthe two variables. It is safe to assume thatthe exact nature <strong>of</strong> the relationship cannot beknown.Analysis <strong>of</strong> Hypothesis 2Hypothesis 2: those at a higher stage <strong>of</strong> racialidentity development will have less decision makingconfusion. To investigate hypothesis 2, a simplelinear regression analysis was conducted withthe pre-encounter subscale <strong>of</strong> the RIAS-B as theindependent variable and decision making confusionraw score as the dependent variable. At theassumed alpha level, the analysis Welded a significantresult (F = 13.36, df 1, 66, p = .001). In other
<strong>Journal</strong> <strong>of</strong> Urban Education: Focus on Enrichment 105words, there was, indeed, a statistically significantrelationship between the two variables. An individual,then, in the pre-encounter stage wouldlikely have a high decision making confusion rawscore.Further, a simple linear regression analysis wasalso conducted with the encounter subscale <strong>of</strong> theRIAS-B as the independent variable and decisionmaking confusion raw score as the dependent variable.The analysis yielded a significant result (F=8.60, df 1, 66, p = .005). In other words, there was astatistically significant relationship between thetwo variables. An individual in the encounterstage would, then, likely have a moderate to highdecision making confusion raw score.A simple linear regression analysis was also conductedwith the immersion / emersion subscale <strong>of</strong>the RIAS-B as the independent variable and decisionmalting confusion raw score as the dependentvariable. At the assumed alpha level, theanalysis yielded a significant result (F = 11.43, df1, 66, p = .001). In other words, there was a statisticallysignificant relationship between the twovariables. This means, then, an individual in theimmersion /emersion stage would probably havea moderate to high decision making confusionraw score.Finally, to address hypothesis 2 further, a simplelinear regression analysis was conducted with theinternalization subscale <strong>of</strong> the RIAS-B as the independentvariable and decision making confusionraw score as the dependent variable. Assumingan alpha level <strong>of</strong> .05, the analysis yielded anonsignificant result (F = .47, df 1, 66, p = .50). Inother words, there was no statistically significantrelationship between the two variables. The exactnature <strong>of</strong> the relationship cannot be described.Analysis <strong>of</strong> Hypothesis 3Hypothesis 3: those at a higher higher stage <strong>of</strong>racial identity development will have less commitmentanxiety. To begin the investigation <strong>of</strong>hypothesis 3, a simple linear regression analysiswas conducted with the pre-encounter subscale <strong>of</strong>the RIAS-B as the independent variable andcommitment anxiety raw score as the dependentvariable. At the assumed alpha level, the analysisyielded a significant result (F=9.21, df 1, 66, p =.003). In other words, there was, indeed, a statisticallysignificant relationship between the two variables.Quite likely, then, an individual in thepre-encounter stage would have a high commitmentanxiety raw score.Additionally, a simple linear regression analysiswas conducted with the encounter subscale <strong>of</strong> theRIAS-B as the independent variable and commitmentanxiety raw score as the dependent variable.The analysis yielded a significant result (F = 11.89, df 1, 66, p =.01). In other words, there was astatistically significant relationship between thetwo variables. This means, then, an individual inthe encounter stage would quite possibly have amoderate to high commitment anxiety raw score.Further, a simple linear regression analysis wasalso conducted with the immersion /emersionsubscale <strong>of</strong> the RIAS-B as the independent variableand commitment anxiety raw score as the dependentvariable. At the assumed alpha level, theanalysis yielded a significant result (F = 6.53, df 1,'66, p = .013). In other words, there was a statisticallysignificant relationship between the two variablesit is most plausible, then, an individual inthe immersion/emersion stage would have amoderate to high commitment anxiety raw score.To conclude the investigation <strong>of</strong> hypothesis 3, asimple linear regression analysis was conductedwith the internalization subscale <strong>of</strong> the RIAS-B asthe independent variable and commitment anxietyraw score as the dependent variable. Assumingan alpha level <strong>of</strong> .05, the analysis yielded a nonsignificantresult (F = .88, df 1, 66, p = .35). In otherwords, there was no statistically significant relationshipbetween the two variables. No description<strong>of</strong> the relationship between the two variablescan be given.Analysis <strong>of</strong> Hypothesis 4Hypothesis 4: those at a higher stage <strong>of</strong> racial