Journal of - Southern University New Orleans
Journal of - Southern University New Orleans
Journal of - Southern University New Orleans
- No tags were found...

Create successful ePaper yourself
Turn your PDF publications into a flip-book with our unique Google optimized e-Paper software.
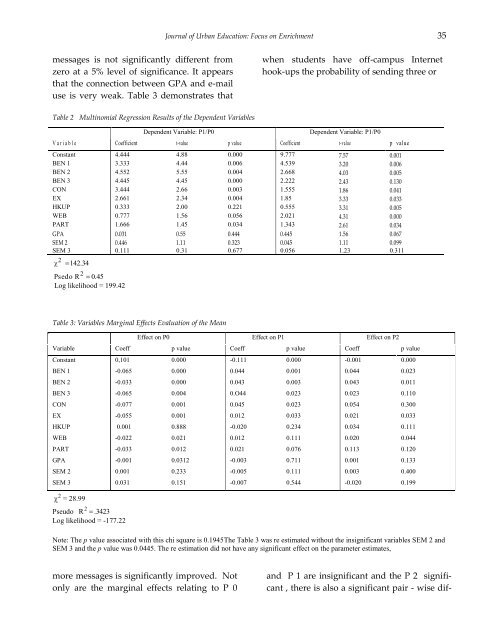
<strong>Journal</strong> <strong>of</strong> Urban Education: Focus on Enrichment 35messages is not significantly different fromzero at a 5% level <strong>of</strong> significance. It appearsthat the connection between GPA and e-mailuse is very weak. Table 3 demonstrates thatwhen students have <strong>of</strong>f-campus Internethook-ups the probability <strong>of</strong> sending three orTable 2 Multinomial Regression Results <strong>of</strong> the Dependent VariablesDependent Variable: P1/P0Dependent Variable: P1/P0V a r i a b l e Coefficient t-value p value Coefficient t-value p valueConstant 4.444 4.88 0.000 9.777 7.57 0.001BEN 1 3.333 4.44 0.006 4.539 3.20 0.006BEN 2 4.552 5.55 0.004 2.668 4.03 0.005BEN 3 4.445 4.45 0.000 2.222 2.43 0.130CON 3.444 2.66 0.003 1.555 1.86 0.041EX 2.661 2.34 0.004 1.85 3.33 0.033HKUP 0.333 2.00 0.221 0.555 3.31 0.005WEB 0.777 1.56 0.056 2.021 4.31 0.000PART 1.666 1.45 0.034 1.343 2.61 0.034GPA 0.031 0.55 0.444 0.445 1.56 0.067SEM 2 0.446 1.11 0.323 0.045 1.11 0.099SEM 3 0.111 0.31 0.677 0.056 1.23 0.3112142.342Psedo R 0.45Log likelihood = 199.42Table 3: Variables Marginal Effects Evaluation <strong>of</strong> the MeanEffect on P0 Effect on P1 Effect on P2Variable Coeff p value Coeff p value Coeff p valueConstant 0,101 0.000 -0.111 0.000 -0.001 0.000BEN 1 -0.065 0.000 0.044 0.001 0.044 0.023BEN 2 -0.033 0.000 0.043 0.003 0.043 0.011BEN 3 -0.065 0.004 0.O44 0.023 0.023 0.110CON -0.077 0.001 0.045 0.023 0.054 0.300EX -0.055 0.001 0.012 0.033 0.021 0.033HKUP 0.001 0.888 -0.020 0.234 0.034 0.111WEB -0.022 0.021 0.012 0.111 0.020 0.044PART -0.033 0.012 0.021 0.076 0.113 0.120GPA -0.001 0.0312 -0.003 0.711 0.001 0.133SEM 2 0.001 0.233 -0.005 0.111 0.003 0.400SEM 3 0.031 0.151 -0.007 0.544 -0.020 0.1992 = 28.99Pseudo R 2 .3423Log likelihood = -177.22Note: The p value associated with this chi square is 0.1945The Table 3 was re estimated without the insignificant variables SEM 2 andSEM 3 and the p value was 0.0445. The re estimation did not have any significant effect on the parameter estimates,more messages is significantly improved. Notonly are the marginal effects relating to P 0and P 1 are insignificant and the P 2 significant, there is also a significant pair - wise dif-