Download this publication as PDF - NanoDrop
Download this publication as PDF - NanoDrop
Download this publication as PDF - NanoDrop

Create successful ePaper yourself
Turn your PDF publications into a flip-book with our unique Google optimized e-Paper software.
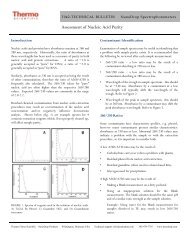
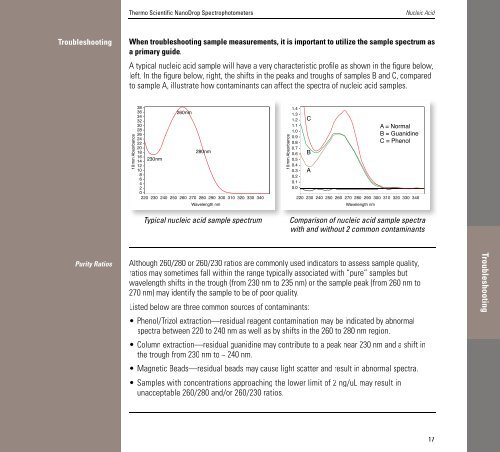
Thermo Scientific <strong>NanoDrop</strong> SpectrophotometersNucleic AcidTroubleshootingWhen troubleshooting sample me<strong>as</strong>urements, it is important to utilize the sample spectrum <strong>as</strong>a primary guide.A typical nucleic acid sample will have a very characteristic profile <strong>as</strong> shown in the figure below,left. In the figure below, right, the shifts in the peaks and troughs of samples B and C, comparedto sample A, illustrate how contaminants can affect the spectra of nucleic acid samples.10mm Absorbance38 - 38 -36 - 36 -34 - 34 -32 - 32 -30 - 30 -28 - 28 -26 - 26 -24 - 24 -22 - 22 -20 - 20 -18 - 18 -16 - 16 -14 - 14230nm-230nm12 - 12 -10 - 10 -8 - 8 -6 - 6 -4 - 4 -2 - 2 -0 - 0 -10mm Absorbance260nm 260nm280nm 280nm10mm Absorbance1.4 - 1.4 -1.3 - 1.3 -1.2 - 1.2 C-1.1 - 1.1 -1.0 - 1.0 -0.9 - 0.9 -0.8 - 0.8 -0.7 - 0.7 -0.6 - 0.6 B-0.5 - 0.5 -0.4 - 0.4 -0.3 - 0.3 A-0.2 - 0.2 -0.1 - 0.1 -0.0 - 0.0 -A = A Normal = NormalB = B = GuanidineC = C Phenol = Phenol220 220 230 230 240 240 250 250 260 260 270 270 280 280 290 290 300 300 310 310 320 320 330 330 340 340 220 220 230 230 240 240 250 250 260 260 270 270 280 280 290 290 300 300 310 310 320 320 330 330 340 340Wavelength Wavelength nm nmWavelength Wavelength nm nm10mm AbsorbanceCBATypical nucleic acid sample spectrumComparison of nucleic acid sample spectraComparison of nucleic acid sample spectrawith and without 2 common contaminantsPurity RatiosAlthough 260/280 or 260/230 ratios are commonly used indicators to <strong>as</strong>sess sample quality,ratios may sometimes fall within the range typically <strong>as</strong>sociated with “pure” samples butwavelength shifts in the trough (from 230 nm to 235 nm) or the sample peak (from 260 nm to270 nm) may identify the sample to be of poor quality.Listed below are three common sources of contaminants:• Phenol/Trizol extraction—residual reagent contamination may be indicated by abnormalspectra between 220 to 240 nm <strong>as</strong> well <strong>as</strong> by shifts in the 260 to 280 nm region.• Column extraction—residual guanidine may contribute to a peak near 230 nm and a shift inthe trough from 230 nm to ~ 240 nm.• Magnetic Beads—residual beads may cause light scatter and result in abnormal spectra.• Samples with concentrations approaching the lower limit of 2 ng/uL may result inunacceptable 260/280 and/or 260/230 ratios.Troubleshooting17