Kinross Wolaroi School 2012 Annual Report
Kinross Wolaroi School 2012 Annual Report
Kinross Wolaroi School 2012 Annual Report

Create successful ePaper yourself
Turn your PDF publications into a flip-book with our unique Google optimized e-Paper software.
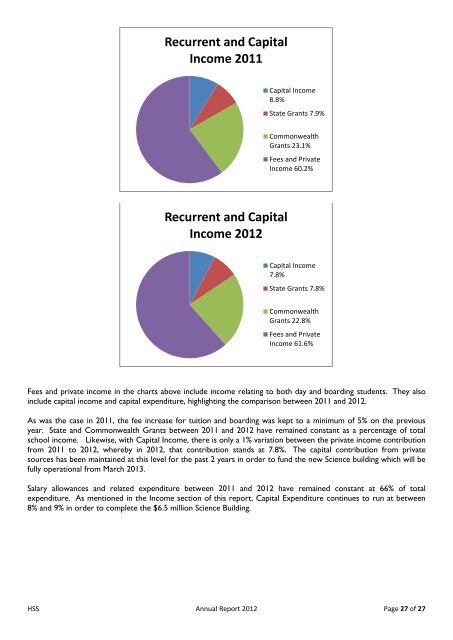
Recurrent and CapitalIncome 2011Capital Income8.8%State Grants 7.9%CommonwealthGrants 23.1%Fees and PrivateIncome 60.2%Recurrent and CapitalIncome <strong>2012</strong>Capital Income7.8%State Grants 7.8%CommonwealthGrants 22.8%Fees and PrivateIncome 61.6%Fees and private income in the charts above include income relating to both day and boarding students. They alsoinclude capital income and capital expenditure, highlighting the comparison between 2011 and <strong>2012</strong>.As was the case in 2011, the fee increase for tuition and boarding was kept to a minimum of 5% on the previousyear. State and Commonwealth Grants between 2011 and <strong>2012</strong> have remained constant as a percentage of totalschool income. Likewise, with Capital Income, there is only a 1% variation between the private income contributionfrom 2011 to <strong>2012</strong>, whereby in <strong>2012</strong>, that contribution stands at 7.8%. The capital contribution from privatesources has been maintained at this level for the past 2 years in order to fund the new Science building which will befully operational from March 2013.Salary allowances and related expenditure between 2011 and <strong>2012</strong> have remained constant at 66% of totalexpenditure. As mentioned in the Income section of this report, Capital Expenditure continues to run at between8% and 9% in order to complete the $6.5 million Science Building.HSS <strong>Annual</strong> <strong>Report</strong> <strong>2012</strong> Page 27 of 27