- Page 1 and 2:
METHODS IN MOLECULAR BIOLOGY 352Pr
- Page 4 and 5:
M E T H O D S I N M O L E C U L A R
- Page 6 and 7:
PrefaceProtein engineering is a fas
- Page 8 and 9:
ContentsPreface ...................
- Page 10 and 11:
ContributorsKATJA M. ARNDT • Inst
- Page 12:
Contributors xiKAZUNARI TAIRA • D
- Page 16 and 17:
1Combinatorial Protein Design Strat
- Page 18 and 19:
Combinatorial Protein Design Strate
- Page 20 and 21:
Combinatorial Protein Design Strate
- Page 22 and 23:
Combinatorial Protein Design Strate
- Page 24 and 25:
Combinatorial Protein Design Strate
- Page 26 and 27:
Combinatorial Protein Design Strate
- Page 28 and 29:
Combinatorial Protein Design Strate
- Page 30 and 31:
Combinatorial Protein Design Strate
- Page 32 and 33:
Combinatorial Protein Design Strate
- Page 34 and 35:
Combinatorial Protein Design Strate
- Page 36 and 37:
2Global Incorporation of Unnatural
- Page 38 and 39:
Incorporation of Unnatural Amino Ac
- Page 40 and 41:
Incorporation of Unnatural Amino Ac
- Page 42 and 43:
Incorporation of Unnatural Amino Ac
- Page 44 and 45:
Incorporation of Unnatural Amino Ac
- Page 46 and 47:
Incorporation of Unnatural Amino Ac
- Page 48 and 49:
3Considerations in the Design and O
- Page 50 and 51:
Design of Coiled Coil Structures 37
- Page 52 and 53:
Design of Coiled Coil Structures 39
- Page 54 and 55:
Design of Coiled Coil Structures 41
- Page 56 and 57:
Design of Coiled Coil Structures 43
- Page 58 and 59:
Design of Coiled Coil Structures 45
- Page 60 and 61:
Design of Coiled Coil Structures 47
- Page 62 and 63:
Design of Coiled Coil Structures 49
- Page 64 and 65:
Design of Coiled Coil Structures 51
- Page 66 and 67:
Design of Coiled Coil Structures 53
- Page 68 and 69:
Design of Coiled Coil Structures 55
- Page 70 and 71:
Design of Coiled Coil Structures 57
- Page 72 and 73:
Design of Coiled Coil Structures 59
- Page 74 and 75:
Design of Coiled Coil Structures 61
- Page 76 and 77:
Design of Coiled Coil Structures 63
- Page 78 and 79:
Design of Coiled Coil Structures 65
- Page 80 and 81:
Design of Coiled Coil Structures 67
- Page 82 and 83:
Design of Coiled Coil Structures 69
- Page 84 and 85:
4Calcium Indicators Based on Calmod
- Page 86 and 87:
Protein-Based Ca 2+ Indicators 73Fi
- Page 88 and 89:
Protein-Based Ca 2+ Indicators 7512
- Page 90 and 91:
Protein-Based Ca 2+ Indicators 77Fi
- Page 92 and 93:
Protein-Based Ca 2+ Indicators 79Fi
- Page 94 and 95:
Protein-Based Ca 2+ Indicators 8145
- Page 96 and 97:
5Design and Synthesis of Artificial
- Page 98 and 99:
Design of Zinc Finger Proteins 853.
- Page 100 and 101:
Design of Zinc Finger Proteins 873.
- Page 102 and 103:
Design of Zinc Finger Proteins 89pr
- Page 104 and 105:
Design of Zinc Finger Proteins 91Fi
- Page 106:
Design of Zinc Finger Proteins 932.
- Page 109 and 110: 96 Koide and Koidewhile retaining t
- Page 111 and 112: 98 Koide and Koide5. M9-tryptone: M
- Page 113 and 114: 100 Koide and Koidetarget-binding s
- Page 115 and 116: 102 Koide and Koide4. Discard the s
- Page 117 and 118: 104 Koide and Koideup to 1 mM for h
- Page 119 and 120: 106 Koide and Koideplate. Incubate
- Page 121 and 122: 108 Koide and Koide1. Perform steps
- Page 124 and 125: 7Engineering Site-Specific Endonucl
- Page 126 and 127: Engineering Site-Specific Endonucle
- Page 128 and 129: 115Fig. 1. Mapping group-specific r
- Page 130 and 131: Engineering Site-Specific Endonucle
- Page 132 and 133: Engineering Site-Specific Endonucle
- Page 134 and 135: Engineering Site-Specific Endonucle
- Page 136: Engineering Site-Specific Endonucle
- Page 140 and 141: 8Protein Library Design and Screeni
- Page 142 and 143: Protein Library Design and Screenin
- Page 144 and 145: Protein Library Design and Screenin
- Page 146 and 147: Protein Library Design and Screenin
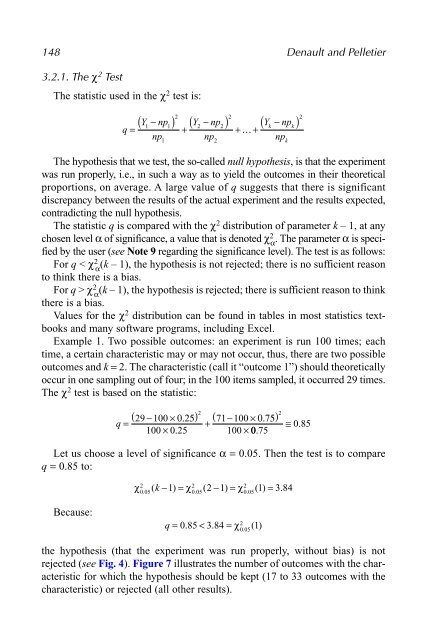
- Page 148 and 149: 135Fig. 2. Excel worksheet describi
- Page 150 and 151: 137Fig. 4. Excel worksheet describi
- Page 152 and 153: Protein Library Design and Screenin
- Page 154 and 155: Protein Library Design and Screenin
- Page 156 and 157: Protein Library Design and Screenin
- Page 158 and 159: Protein Library Design and Screenin
- Page 162 and 163: Protein Library Design and Screenin
- Page 164 and 165: Protein Library Design and Screenin
- Page 166 and 167: Protein Library Design and Screenin
- Page 168 and 169: 9Protein Design by Binary Patternin
- Page 170 and 171: Protein Design by Binary Patterning
- Page 172 and 173: Protein Design by Binary Patterning
- Page 174 and 175: Protein Design by Binary Patterning
- Page 176 and 177: Protein Design by Binary Patterning
- Page 178 and 179: Protein Design by Binary Patterning
- Page 180 and 181: 10Versatile DNA Fragmentation and D
- Page 182 and 183: NExT DNA Shuffling 169This chapter
- Page 184 and 185: NExT DNA Shuffling 1713. Methods3.1
- Page 186 and 187: NExT DNA Shuffling 17372°C, 4 min.
- Page 188 and 189: NExT DNA Shuffling 175Fig. 2. Varia
- Page 190 and 191: NExT DNA Shuffling 1773.5.1. Direct
- Page 192 and 193: NExT DNA Shuffling 179Fig. 3. Reass
- Page 194 and 195: 181
- Page 196 and 197: NExT DNA Shuffling 183likelihood of
- Page 198 and 199: NExT DNA Shuffling 1853.9.2. Calibr
- Page 200 and 201: NExT DNA Shuffling 187staining. Bec
- Page 202 and 203: NExT DNA Shuffling 1894. Zhao, H.,
- Page 204 and 205: 11Degenerate Oligonucleotide Gene S
- Page 206 and 207: Degenerate Oligonucleotide Gene Shu
- Page 208 and 209: Degenerate Oligonucleotide Gene Shu
- Page 210 and 211:
Degenerate Oligonucleotide Gene Shu
- Page 212 and 213:
Degenerate Oligonucleotide Gene Shu
- Page 214 and 215:
Degenerate Oligonucleotide Gene Shu
- Page 216 and 217:
Degenerate Oligonucleotide Gene Shu
- Page 218 and 219:
12M13 Bacteriophage Coat Proteins E
- Page 220 and 221:
Engineered M13 Bacteriophage Coat P
- Page 222 and 223:
Engineered M13 Bacteriophage Coat P
- Page 224 and 225:
Engineered M13 Bacteriophage Coat P
- Page 226 and 227:
Engineered M13 Bacteriophage Coat P
- Page 228 and 229:
Engineered M13 Bacteriophage Coat P
- Page 230 and 231:
Engineered M13 Bacteriophage Coat P
- Page 232:
Engineered M13 Bacteriophage Coat P
- Page 235 and 236:
222 Fujita et al.The methods that h
- Page 237 and 238:
224 Fujita et al.3. Streptavidin an
- Page 239 and 240:
226 Fujita et al.Fig. 2. (Continued
- Page 241 and 242:
228 Fujita et al.Fig. 3. (Continued
- Page 243 and 244:
230 Fujita et al.Fig. 3. (A) Schema
- Page 245 and 246:
232 Fujita et al.1. Add 2 µg mRNA
- Page 247 and 248:
234 Fujita et al.Innovative Bioscie
- Page 249 and 250:
236 Fujita et al.30. Kim, Y., Mlsa,
- Page 251 and 252:
238 Ghadessy and Holligeraffinity m
- Page 253 and 254:
240 Ghadessy and HolligerFig. 1. (A
- Page 255 and 256:
242 Ghadessy and HolligerFinally, t
- Page 257 and 258:
244 Ghadessy and Holliger2. Prepare
- Page 259 and 260:
246 Ghadessy and Holliger2. After 6
- Page 261 and 262:
248 Ghadessy and Holliger21. Oberho
- Page 263 and 264:
250 Campbell-Valois and Michnickscr
- Page 265 and 266:
252 Campbell-Valois and Michnickfol
- Page 267 and 268:
254 Campbell-Valois and Michnick7.
- Page 269 and 270:
256 Campbell-Valois and MichnickFig
- Page 271 and 272:
258 Campbell-Valois and Michnickres
- Page 273 and 274:
260Fig. 3. BL21 pREP4 cells were co
- Page 275 and 276:
262 Campbell-Valois and MichnickFig
- Page 277 and 278:
264 Campbell-Valois and Michnickvar
- Page 279 and 280:
266 Campbell-Valois and Michnick3.
- Page 281 and 282:
268 Campbell-Valois and Michnick7.
- Page 283 and 284:
270 Campbell-Valois and Michnick21.
- Page 285 and 286:
272 Campbell-Valois and Michnick16.
- Page 287 and 288:
274 Campbell-Valois and Michnick48.
- Page 289 and 290:
276 Hecky et al.improved half-life
- Page 291 and 292:
278 Hecky et al.Fig. 1. (A) Scheme
- Page 293 and 294:
280 Hecky et al.11. Reverse primer
- Page 295 and 296:
282 Hecky et al.high variability in
- Page 297 and 298:
284 Hecky et al.coding sequence for
- Page 299 and 300:
286 Hecky et al.4. Analyze the resu
- Page 301 and 302:
Table 1Amino Acid Substitutions Sel
- Page 303 and 304:
290 Hecky et al.Fig. 4. Structure o
- Page 305 and 306:
292 Hecky et al.Fig. 5. Expression
- Page 307 and 308:
294 Hecky et al.Table 2Kinetic Para
- Page 309 and 310:
296 Hecky et al.The thermoactivity
- Page 311 and 312:
298 Hecky et al.Fig. 8. Unfolding o
- Page 313 and 314:
300 Hecky et al.for the first trans
- Page 315 and 316:
302 Hecky et al.7. Thompson, M. J.
- Page 317 and 318:
304 Hecky et al.40. Wang, X., Minas
- Page 319 and 320:
306 IndexCCalcium indicators, see C
- Page 321 and 322:
308 Indexchemiocompetent cellprepar
- Page 323 and 324:
310 Indexmaterials, 169, 170mutatio
- Page 325:
312 IndexTerminal truncation, see a