Issue1. Vol.1 (April, 2013) - IIT Mandi
Issue1. Vol.1 (April, 2013) - IIT Mandi
Issue1. Vol.1 (April, 2013) - IIT Mandi
- No tags were found...

Create successful ePaper yourself
Turn your PDF publications into a flip-book with our unique Google optimized e-Paper software.
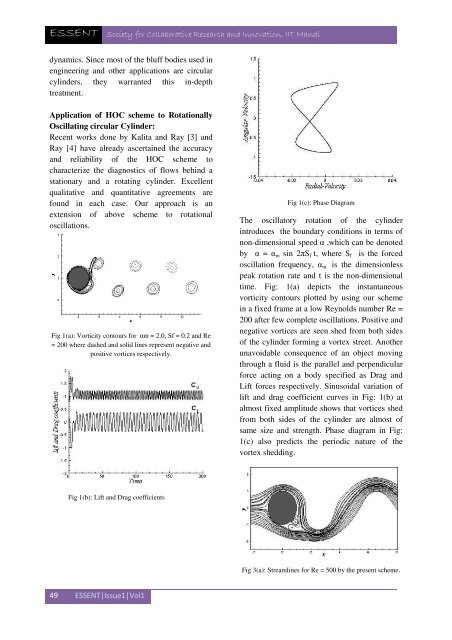
ESSENT Society for Collaborative Research and Innovation, <strong>IIT</strong> <strong>Mandi</strong>dynamics. Since most of the bluff bodies used inengineering and other applications are circularcylinders, they warranted this in-depthtreatment.Application of HOC scheme to RotationallyOscillating circular Cylinder:Recent works done by Kalita and Ray [3] andRay [4] have already ascertained the accuracyand reliability of the HOC scheme tocharacterize the diagnostics of flows behind astationary and a rotating cylinder. Excellentqualitative and quantitative agreements arefound in each case. Our approach is anextension of above scheme to rotationaloscillations.Fig 1(a): Vorticity contours for αm = 2.0, Sf = 0.2 and Re= 200 where dashed and solid lines represent negative andpositive vortices respectively.Fig 1(c): Phase DiagramThe oscillatory rotation of the cylinderintroduces the boundary conditions in terms ofnon-dimensional speed α ,which can be denotedby α = α m sin 2πS f t, where S f is the forcedoscillation frequency, α m is the dimensionlesspeak rotation rate and t is the non-dimensionaltime. Fig: 1(a) depicts the instantaneousvorticity contours plotted by using our schemein a fixed frame at a low Reynolds number Re =200 after few complete oscillations. Positive andnegative vortices are seen shed from both sidesof the cylinder forming a vortex street. Anotherunavoidable consequence of an object movingthrough a fluid is the parallel and perpendicularforce acting on a body specified as Drag andLift forces respectively. Sinusoidal variation oflift and drag coefficient curves in Fig: 1(b) atalmost fixed amplitude shows that vortices shedfrom both sides of the cylinder are almost ofsame size and strength. Phase diagram in Fig:1(c) also predicts the periodic nature of thevortex shedding.Fig 1(b): Lift and Drag coefficientsFig 3(a): Streamlines for Re = 500 by the present scheme.49 ESSENT|Issue1|Vol1