Issue1. Vol.1 (April, 2013) - IIT Mandi
Issue1. Vol.1 (April, 2013) - IIT Mandi
Issue1. Vol.1 (April, 2013) - IIT Mandi
- No tags were found...

You also want an ePaper? Increase the reach of your titles
YUMPU automatically turns print PDFs into web optimized ePapers that Google loves.
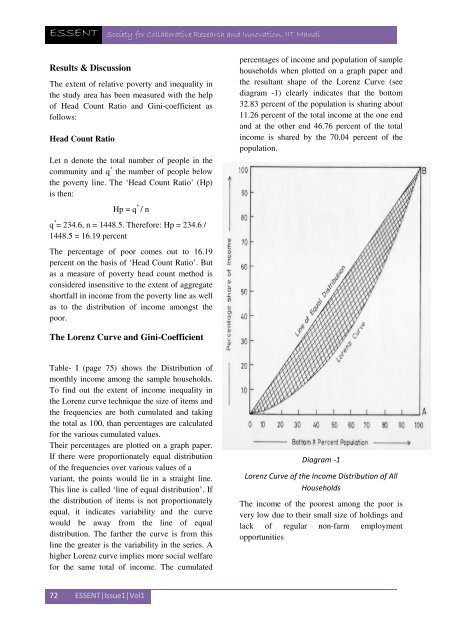
ESSENT Society for Collaborative Research and Innovation, <strong>IIT</strong> <strong>Mandi</strong>Results & DiscussionThe extent of relative poverty and inequality inthe study area has been measured with the helpof Head Count Ratio and Gini-coefficienfollows: asHead Count RatioLet n denote the total number of people in thecommunity and q * the number of people belowthe poverty line. The ‘Head Count Ratio’ (Hp)is then:Hp = q * / nq * = 234.6, n = 1448.5. Therefore: Hp = 234.6 /1448.5 = 16.19 percentThe percentage of poor comes out to 16.19percent on the basis of ‘Head Count Ratio’. Butas a measure of poverty head count method isconsidered insensitive to the extent of aggregateshortfall in income from the poverty line as wellas to the distribution of income amongst thepoor.percentages of income and population of samplehouseholds when plotted on a graph paper andthe resultant shape of the Lorenz Curve (seediagram -1) clearly indicates that the bottom32.83 percent of the population is sharing about11.26 percent of the total income at the one endand at the other end 46.76 percent of the totalincome is shared by the 70.04 percent of thepopulation.The Lorenz Curve and Gini-CoefficientTable- I (page 75) shows the Distribution ofmonthly income among the sample households.To find out the extent of income inequality inthe Lorenz curve technique the size of items andthe frequencies are both cumulated and takingthe total as 100, than percentages are calculatedfor the various cumulated values.Their percentages are plotted on a graph paper.If there were proportionately equal distributionof the frequencies over various values of avariant, the points would lie in a straight line.This line is called ‘line of equal distribution’. Ifthe distribution of items is not proportionatelyequal, it indicates variability and the curvewould be away from the line of equaldistribution. The farther the curve is from thisline the greater is the variability in the series. Ahigher Lorenz curve implies more social welfarefor the same total of income. The cumulatedDiagram -1Lorenz Curve of the Income Distribution of AllHouseholdsThe income of the poorest among the poor isvery low due to their small size of holdings andlack of regular non-farm employmentopportunities72 ESSENT|Issue1|Vol1