Issue1. Vol.1 (April, 2013) - IIT Mandi
Issue1. Vol.1 (April, 2013) - IIT Mandi
Issue1. Vol.1 (April, 2013) - IIT Mandi
- No tags were found...
You also want an ePaper? Increase the reach of your titles
YUMPU automatically turns print PDFs into web optimized ePapers that Google loves.
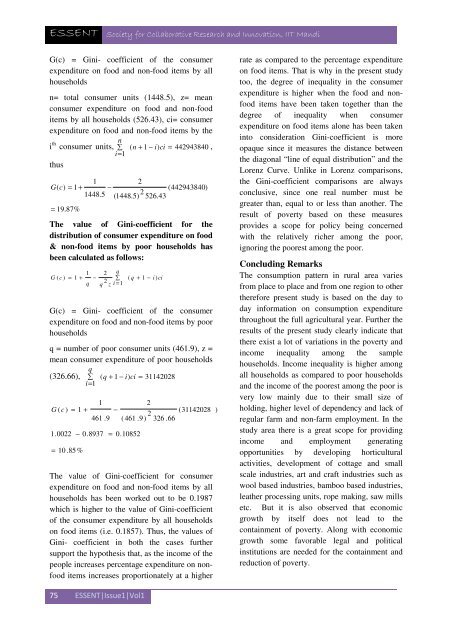
ESSENT Society for Collaborative Research and Innovation, <strong>IIT</strong> <strong>Mandi</strong>G(c) = Gini- coefficient of the consumerexpenditure on food and non-food items by allhouseholdsn= total consumer units (1448.5), z= meanconsumer expenditure on food and non-fooditems by all households (526.43), ci= consumerexpenditure on food and non-food items by thei th nconsumer units, ∑ ( n + 1 − i)ci = 442943840 ,i = 1thus12G(c)= 1 + −(442943840)1448.5 2(1448.5) 526.43= 19.87%The value of Gini-coefficient for thedistribution of consumer expenditure on food& non-food items by poor households hasbeen calculated as follows:1 2 qG ( c ) = 1 + − ∑ ( q + 1 − i ) ciq2q z i = 1G(c) = Gini- coefficient of the consumerexpenditure on food and non-food items by poorhouseholdsq = number of poor consumer units (461.9), z =mean consumer expenditure of poor householdsq(326.66), ∑ ( q + 1 − i)ci = 31142028i = 1G ( c ) = 1 += 10 .85 %1461 .91.0022 − 0.8937 =−2( 461 .9)0.108522326 .66(31142028The value of Gini-coefficient for consumerexpenditure on food and non-food items by allhouseholds has been worked out to be 0.1987which is higher to the value of Gini-coefficientof the consumer expenditure by all householdson food items (i.e. 0.1857). Thus, the values ofGini- coefficient in both the cases furthersupport the hypothesis that, as the income of thepeople increases percentage expenditure on nonfooditems increases proportionately at a higher)rate as compared to the percentage expenditureon food items. That is why in the present studytoo, the degree of inequality in the consumerexpenditure is higher when the food and nonfooditems have been taken together than thedegree of inequality when consumerexpenditure on food items alone has been takeninto consideration Gini-coefficient is moreopaque since it measures the distance betweenthe diagonal “line of equal distribution” and theLorenz Curve. Unlike in Lorenz comparisons,the Gini-coefficient comparisons are alwaysconclusive, since one real number must begreater than, equal to or less than another. Theresult of poverty based on these measuresprovides a scope for policy being concernedwith the relatively richer among the poor,ignoring the poorest among the poor.Concluding RemarksThe consumption pattern in rural area variesfrom place to place and from one region to othertherefore present study is based on the day today information on consumption expenditurethroughout the full agricultural year. Further theresults of the present study clearly indicate thatthere exist a lot of variations in the poverty andincome inequality among the samplehouseholds. Income inequality is higher amongall households as compared to poor householdsand the income of the poorest among the poor isvery low mainly due to their small size ofholding, higher level of dependency and lack ofregular farm and non-farm employment. In thestudy area there is a great scope for providingincome and employment generatingopportunities by developing horticulturalactivities, development of cottage and smallscale industries, art and craft industries such aswool based industries, bamboo based industries,leather processing units, rope making, saw millsetc. But it is also observed that economicgrowth by itself does not lead to thecontainment of poverty. Along with economicgrowth some favorable legal and politicalinstitutions are needed for the containment andreduction of poverty.75 ESSENT|Issue1|Vol1


