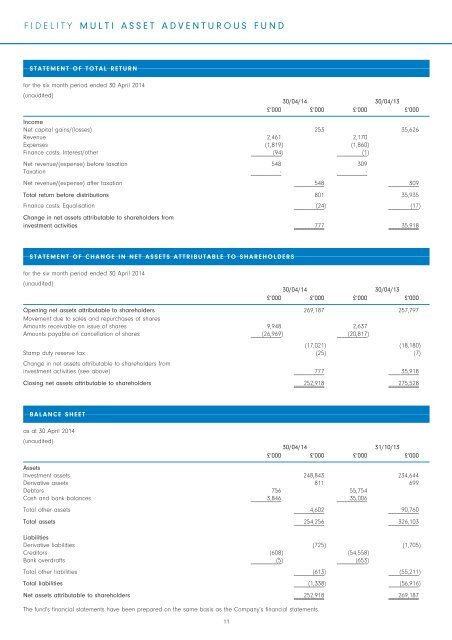
FIDELITYMULTI ASSET ADVENTUROUS FUNDSTATEMENT OF TOTAL RETURNfor the six month period ended 30 April 2014(unaudited)30/04/14 30/04/13£’000 £’000 £’000 £’000IncomeNet capital gains/(losses) 253 35,626Revenue 2,461 2,170Expenses (1,819) (1,860)Finance costs: Interest/other (94) (1)Net revenue/(expense) before taxation 548 309Taxation - -Net revenue/(expense) after taxation 548 309Total return before distributions 801 35,935Finance costs: Equalisation (24) (17)Change in net assets attributable to shareholders frominvestment activities 777 35,918STATEMENT OF CHANGE IN NET ASSETS ATTRIBUTABLE TO SHAREHOLDERSfor the six month period ended 30 April 2014(unaudited)30/04/14 30/04/13£’000 £’000 £’000 £’000Opening net assets attributable to shareholders 269,187 257,797Movement due to sales <strong>and</strong> repurchases of sharesAmounts receivable on issue of shares 9,948 2,637Amounts payable on cancellation of shares (26,969) (20,817)(17,021) (18,180)Stamp duty reserve tax (25) (7)Change in net assets attributable to shareholders frominvestment activities (see above) 777 35,918Closing net assets attributable to shareholders 252,918 275,528BALANCE SHEETas at 30 April 2014(unaudited)30/04/14 31/10/13£’000 £’000 £’000 £’000Assets<strong>Investment</strong> assets 248,843 234,644Derivative assets 811 699Debtors 756 55,754Cash <strong>and</strong> bank balances 3,846 35,006Total other assets 4,602 90,760Total assets 254,256 326,103LiabilitiesDerivative liabilities (725) (1,705)Creditors (608) (54,558)Bank overdrafts (5) (653)Total other liabilities (613) (55,211)Total liabilities (1,338) (56,916)Net assets attributable to shareholders 252,918 269,187The fund’s financial statements have been prepared on the same basis as the Company’s financial statements.11
FIDELITY MULTI ASSET ALLOCATOR ADVENTUROUS FUNDINVESTMENT OBJECTIVE AND POLICYThe fund aims to provide long term capital growth by investing primarilythrough regulated collective investment schemes, including schemes managedby <strong>Fidelity</strong> in order to obtain a global exposure to mostly equities <strong>and</strong>commodities. The Fund may also invest directly in other transferable securities,money market instruments, cash <strong>and</strong> deposits. Derivatives <strong>and</strong> forwardtransactions may also be used for investment purposes.NB: It is anticipated that the Fund will mainly invest in index tracking funds withthe aim of pursuing a lower cost investment approach.FUND MANAGER’S COMMENTARYMARKET REVIEWCommodities outperformed other asset classes over the period as badweather boosted prices in the energy <strong>and</strong> agriculture sectors. Energy pricesrose due to the unseasonably cold winter in the US, while the drought in Brazildrove up coffee prices to a record high. Meanwhile, improving economic data<strong>and</strong> continued monetary support from central banks in developed marketssupported equities. However, gains were limited by worries about the impactof the reduction in money supply by the US Federal Reserve (Fed), slow growthin China <strong>and</strong> rising geopolitical tensions in Ukraine. The real estate sectorunderperformed following the Fed’s announcement that it could begintapering money supply. A reduction in money supply could lead to a rise ininterest rates, which would likely impact property shares as they are sensitiveto changes in interest rates.PORTFOLIO ACTIVITYTactical asset allocation negatively impacted returns. Based on my positiveview on global growth, I positioned the fund to benefit from an improvingeconomic environment by maintaining a bias towards equities at the expenseof other asset classes. However, in equity regions, an overweight stance inJapan, notably positions in iShares MSCI Japan Fund <strong>and</strong> Northern Trust JapanEquity Index Fund held back performance. The position in the former was sold,while the exposure to the latter was reduced. A preference for Pacific exJapan <strong>and</strong> emerging market equities also detracted from returns amidconcerns about slow growth in China, the largest export market for bothregions. Consequently, the exposure to both regions was scaled down byreducing the allocation to iShares MSCI Pacific Ex-Japan Fund <strong>and</strong> iSharesMSCI Emerging Markets Fund. On a positive note, an overweight stance in theUS <strong>and</strong> Europe ex UK equities supported returns. The allocation to the latterwas raised in light of a pickup in growth by increasing holdings in <strong>Fidelity</strong>Index Europe ex UK Fund <strong>and</strong> iShares MSCI Europe ex-UK Fund. Elsewhere, Ibelieved that slow growth in China, the largest consumer of industrial metals,will hurt commodity prices. Therefore, I reduced the allocation to commoditiesduring the period. However, the underweight stance in the asset classdetracted from returns as commodities rose on the back of harsh weather.Nonetheless, I believe this was an unexpected short-term gain, <strong>and</strong> retain myunderweight in the sector. In the real estate segment, I increased the exposureto BlackRock Global Property Securities Equity Fund.OUTLOOKThe macroeconomic environment remains broadly supportive of equities. At aregional level, the US is favoured on the back of improving corporate earnings<strong>and</strong> signs of stable growth. Equities in Japan could be volatile due to theimpact of the sales tax increase. Meanwhile, Pacific ex Japan <strong>and</strong> emergingmarkets could be hurt by weakening growth in China, the major export marketfor both regions. Elsewhere, the weather induced strength in commodities islikely to fade.PERFORMANCE RECORDDISCRETE 1 YEAR PERFORMANCE OVER THE LAST 5 YEARS TO:30/04/10 30/04/11 30/04/12 30/04/13 30/04/14A Accumulation Shares - - - - 2.0Y Accumulation Shares - - - - 2.6<strong>Fidelity</strong> PathFinder Foundation 4Accumulation Shares - - - - 2.1N Accumulation Shares - - - - -<strong>Fidelity</strong> PathFinder Foundation 4Accumulation (clean) Shares - - - - -* Comparative Index - - - - 3.6* Comparative Index: Comprises 15% Dow Jones - UBS Commodity Index Total Return, 25% FTSE AllShare Index, 50% MSCI All Countries World Index (Net) & 10% FTSE EPRA/NAREIT Developed Index (G)Source: <strong>Fidelity</strong> <strong>and</strong> RIMES, bid to bid, UK£, net income reinvested. Pastperformance is not a realiable indicator of future results.RISK PROFILEIf you make regular withdrawals from your investment, this may reduce yourcapital over time if the fund’s growth does not compensate for the withdrawals.The value of investments <strong>and</strong> the income from it can go down as well as up soyou may not get back the amount you invested. Some funds are able to investsome or all of their assets in developing overseas markets which carry a higherrisk than investing in larger established markets. <strong>Investment</strong>s in emergingmarkets are likely to experience greater rises <strong>and</strong> falls in value <strong>and</strong> there maybe trading difficulties. Some funds invest in overseas markets. This means thatchanges in currency exchange rates will affect the value of your investment. Forsome funds, derivatives <strong>and</strong> forward transactions may be used for specificinvestment purposes, as well as for hedging <strong>and</strong> other efficient managementpurposes as permitted for all funds. Where this is the case, their use may leadto higher volatility in the fund’s share price. For funds that use derivativetransactions, there is a risk that the counterparty to the transaction will whollyor partially fail to honour its contractual obligations. This may result in financialloss to the fund. We assess the creditworthiness of counterparties as part of ourrisk management process. Each of our funds is operated as a separate entitywith its own assets <strong>and</strong> liabilities. However, if the liabilities of one fund were toexceed its assets, the other funds within the scheme might have to transferacross money to cover the liabilities. This means that the fund you invest in maybe worth less if it has to transfer money to another fund.Trevor GreethamFund Manager30 April 14* Holdings can vary from those in the index quoted. For this reason thecomparative index is used for reference only.12