Semi-Annual Reports and Accounts - Fidelity Worldwide Investment
Semi-Annual Reports and Accounts - Fidelity Worldwide Investment
Semi-Annual Reports and Accounts - Fidelity Worldwide Investment

Create successful ePaper yourself
Turn your PDF publications into a flip-book with our unique Google optimized e-Paper software.
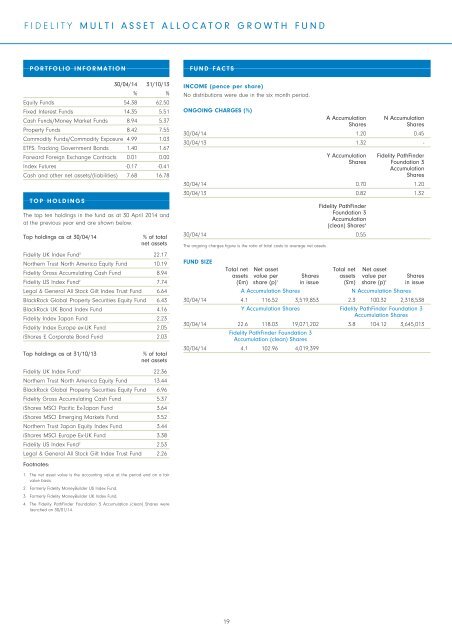
FIDELITYMULTI ASSET ALLOCATOR GROWTH FUNDPORTFOLIO INFORMATION30/04/14 31/10/13% %Equity Funds 54.38 62.50Fixed Interest Funds 14.35 5.51Cash Funds/Money Market Funds 8.94 5.37Property Funds 8.42 7.55Commodity Funds/Commodity Exposure 4.99 1.03ETFS: Tracking Government Bonds 1.40 1.67Forward Foreign Exchange Contracts 0.01 0.00Index Futures -0.17 -0.41Cash <strong>and</strong> other net assets/(liabilities) 7.68 16.78TOP HOLDINGSThe top ten holdings in the fund as at 30 April 2014 <strong>and</strong>at the previous year end are shown below.Top holdings as at 30/04/14% of totalnet assets<strong>Fidelity</strong> UK Index Fund 3 22.17Northern Trust North America Equity Fund 10.19<strong>Fidelity</strong> Gross Accumulating Cash Fund 8.94<strong>Fidelity</strong> US Index Fund 2 7.74Legal & General All Stock Gilt Index Trust Fund 6.64BlackRock Global Property Securities Equity Fund 6.43BlackRock UK Bond Index Fund 4.16<strong>Fidelity</strong> Index Japan Fund 2.23<strong>Fidelity</strong> Index Europe ex-UK Fund 2.05iShares £ Corporate Bond Fund 2.03Top holdings as at 31/10/13% of totalnet assets<strong>Fidelity</strong> UK Index Fund 3 22.36Northern Trust North America Equity Fund 13.44BlackRock Global Property Securities Equity Fund 6.96<strong>Fidelity</strong> Gross Accumulating Cash Fund 5.37iShares MSCI Pacific Ex-Japan Fund 3.64iShares MSCI Emerging Markets Fund 3.52Northern Trust Japan Equity Index Fund 3.44iShares MSCI Europe Ex-UK Fund 3.38<strong>Fidelity</strong> US Index Fund 2 2.53Legal & General All Stock Gilt Index Trust Fund 2.26Footnotes:FUND FACTSINCOME (pence per share)No distributions were due in the six month period.ONGOING CHARGES (%)A Accumulation N AccumulationSharesShares30/04/14 1.20 0.4530/04/13 1.32 -Y Accumulation <strong>Fidelity</strong> PathFinderShares Foundation 3AccumulationShares30/04/14 0.70 1.2030/04/13 0.82 1.32<strong>Fidelity</strong> PathFinderFoundation 3Accumulation(clean) Shares 430/04/14 0.55The ongoing charges figure is the ratio of total costs to average net assets.FUND SIZETotal net Net asset Total net Net assetassets value per Shares assets value per Shares(£m) share (p) 1 in issue (£m) share (p) 1 in issueA Accumulation SharesN Accumulation Shares30/04/14 4.1 116.52 3,519,853 2.3 100.32 2,318,538Y Accumulation Shares <strong>Fidelity</strong> PathFinder Foundation 3Accumulation Shares30/04/14 22.6 118.03 19,071,202 3.8 104.12 3,645,013<strong>Fidelity</strong> PathFinder Foundation 3Accumulation (clean) Shares30/04/14 4.1 102.96 4,019,3991. The net asset value is the accounting value at the period end on a fairvalue basis.2. Formerly <strong>Fidelity</strong> MoneyBuilder US Index Fund.3. Formerly <strong>Fidelity</strong> MoneyBuilder UK Index Fund.4. The <strong>Fidelity</strong> PathFinder Foundation 3 Accumulation (clean) Shares werelaunched on 30/01/14.19