Semi-Annual Reports and Accounts - Fidelity Worldwide Investment
Semi-Annual Reports and Accounts - Fidelity Worldwide Investment
Semi-Annual Reports and Accounts - Fidelity Worldwide Investment

Create successful ePaper yourself
Turn your PDF publications into a flip-book with our unique Google optimized e-Paper software.
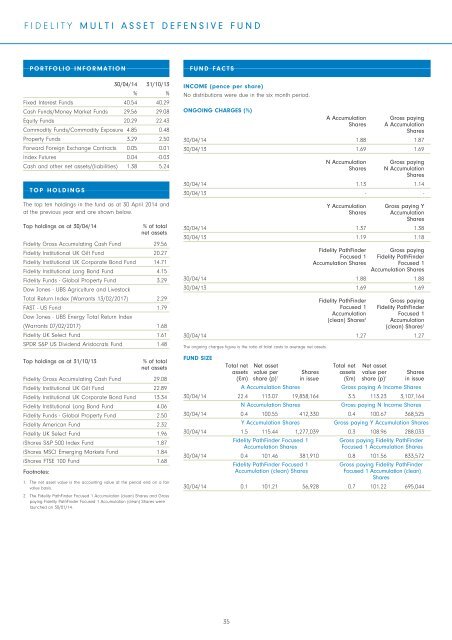
FIDELITYMULTI ASSET DEFENSIVE FUNDPORTFOLIO INFORMATION30/04/14 31/10/13% %Fixed Interest Funds 40.54 40.29Cash Funds/Money Market Funds 29.56 29.08Equity Funds 20.29 22.43Commodity Funds/Commodity Exposure 4.85 0.48Property Funds 3.29 2.50Forward Foreign Exchange Contracts 0.05 0.01Index Futures 0.04 -0.03Cash <strong>and</strong> other net assets/(liabilities) 1.38 5.24TOP HOLDINGSThe top ten holdings in the fund as at 30 April 2014 <strong>and</strong>at the previous year end are shown below.Top holdings as at 30/04/14% of totalnet assets<strong>Fidelity</strong> Gross Accumulating Cash Fund 29.56<strong>Fidelity</strong> Institutional UK Gilt Fund 20.27<strong>Fidelity</strong> Institutional UK Corporate Bond Fund 14.71<strong>Fidelity</strong> Institutional Long Bond Fund 4.15<strong>Fidelity</strong> Funds - Global Property Fund 3.29Dow Jones - UBS Agriculture <strong>and</strong> LivestockTotal Return Index (Warrants 13/02/2017) 2.29FAST - US Fund 1.79Dow Jones - UBS Energy Total Return Index(Warrants 07/02/2017) 1.68<strong>Fidelity</strong> UK Select Fund 1.61SPDR S&P US Dividend Aristocrats Fund 1.48Top holdings as at 31/10/13% of totalnet assets<strong>Fidelity</strong> Gross Accumulating Cash Fund 29.08<strong>Fidelity</strong> Institutional UK Gilt Fund 22.89<strong>Fidelity</strong> Institutional UK Corporate Bond Fund 13.34<strong>Fidelity</strong> Institutional Long Bond Fund 4.06<strong>Fidelity</strong> Funds - Global Property Fund 2.50<strong>Fidelity</strong> American Fund 2.32<strong>Fidelity</strong> UK Select Fund 1.96iShares S&P 500 Index Fund 1.87iShares MSCI Emerging Markets Fund 1.84iShares FTSE 100 Fund 1.68Footnotes:1. The net asset value is the accounting value at the period end on a fairvalue basis.2. The <strong>Fidelity</strong> PathFinder Focused 1 Accumulation (clean) Shares <strong>and</strong> Grosspaying <strong>Fidelity</strong> PathFinder Focused 1 Accumulation (clean) Shares werelaunched on 30/01/14.FUND FACTSINCOME (pence per share)No distributions were due in the six month period.ONGOING CHARGES (%)A Accumulation Gross payingShares A AccumulationShares30/04/14 1.88 1.8730/04/13 1.69 1.69N Accumulation Gross payingShares N AccumulationShares30/04/14 1.13 1.1430/04/13 - -Y Accumulation Gross paying YShares AccumulationShares30/04/14 1.37 1.3830/04/13 1.19 1.18<strong>Fidelity</strong> PathFinder Gross payingFocused 1 <strong>Fidelity</strong> PathFinderAccumulation Shares Focused 1Accumulation Shares30/04/14 1.88 1.8830/04/13 1.69 1.69<strong>Fidelity</strong> PathFinder Gross payingFocused 1 <strong>Fidelity</strong> PathFinderAccumulation Focused 1(clean) Shares 2 Accumulation(clean) Shares 230/04/14 1.27 1.27The ongoing charges figure is the ratio of total costs to average net assets.FUND SIZETotal net Net asset Total net Net assetassets value per Shares assets value per Shares(£m) share (p) 1 in issue (£m) share (p) 1 in issueA Accumulation SharesGross paying A Income Shares30/04/14 22.4 113.07 19,858,164 3.5 113.23 3,107,164N Accumulation SharesGross paying N Income Shares30/04/14 0.4 100.55 412,330 0.4 100.67 368,525Y Accumulation SharesGross paying Y Accumulation Shares30/04/14 1.5 115.44 1,277,039 0.3 108.96 288,033<strong>Fidelity</strong> PathFinder Focused 1Gross paying <strong>Fidelity</strong> PathFinderAccumulation SharesFocused 1 Accumulation Shares30/04/14 0.4 101.46 381,910 0.8 101.56 833,572<strong>Fidelity</strong> PathFinder Focused 1Gross paying <strong>Fidelity</strong> PathFinderAccumulation (clean) SharesFocused 1 Accumulation (clean)Shares30/04/14 0.1 101.21 56,928 0.7 101.22 695,04435