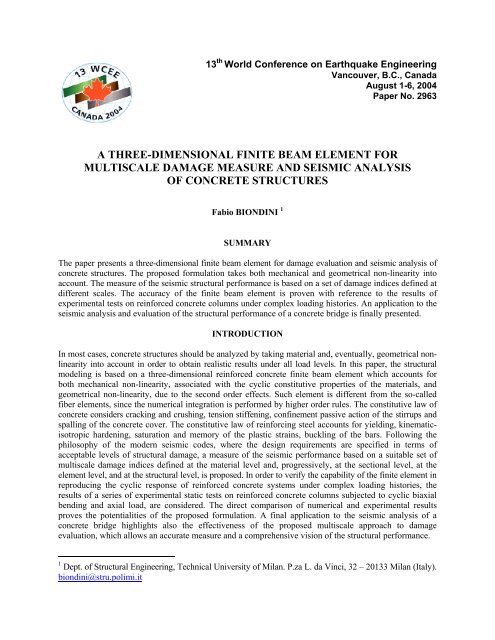
a three-dimensional finite beam element for multiscale damage ...
a three-dimensional finite beam element for multiscale damage ...
a three-dimensional finite beam element for multiscale damage ...
- No tags were found...

You also want an ePaper? Increase the reach of your titles
YUMPU automatically turns print PDFs into web optimized ePapers that Google loves.
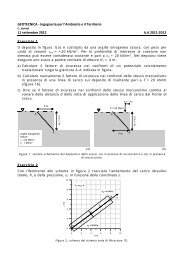
Table 1. Limit points of the cyclic constitutive law of concrete.rε1ε1 = max ε ε ∈ Iσ1=rr −1+ε1σ1ε2= ε1− ( ε1+ εa)σ 0σ + E ε2=1 { }233ε1410aε = σ3= 0.92σ1+ 0.08σR≥ 0. 92σ1σ1−σ3rε4ε4= ε1+ ( 2 + k)σ4=rr −1+εE R5 ε = min{ ε ε ∈ }5I⎧ϕEσ5 ⎨⎩σcrσ 6=6 ε 6= ε 5− εt0= last ε ∆ε< 0σ U= σ ( ε UU { }R = last { ε ∆ε> 0 }ε U)ε Rσ = σ ε )R4( ε − ε )=∗( R[ − λ ( ε − ε )]0 5 2{(1−α)exp+ α}5cr, εcr≤ ε5≤ ε2, ε < ε1. Point of maximum strain ε on the envelope curve I .2. Point of transition between compression and tension.3. Point of reloading in the elastic phase.4. Point of return on the branch in compression of the envelope curve I .5. Point of minimum strain ε on the envelope curve I .6. Point of transition between compression and tension.U. Point of last unloading with ∆ε < 0 .R. Point of last reloading with ∆ε > 0 .ε =⎧ 1aa ε 1= ⎨ ; 0.091⎩1+⎭ ⎬⎫ σ3−σR1a maxε E R=εcr= ε 2+ ε tσ cr= ϕσtϕ =4ε1ε3− εR1+0.3ε1For the rein<strong>for</strong>cing steel, the cyclic constitutive law refers to the models developed by Goldberg andRichard (1963), Giuffrè and Pinto (1970), Menegotto and Pinto (1973), Monti and Nuti (1992). Details ofits implementation can be found in Biondini (2000). Here it is only recalled that such law accounts <strong>for</strong>yielding, kinematic-isotropic hardening, saturation and memory of the plastic strains, buckling of the bars.Numerical Integration of the Finite Element CharacteristicsThe quantities which define the characteristics of the <strong>finite</strong> <strong>element</strong> are evaluated by numerical integration.To this aim, the volume of the <strong>element</strong> is subdivided in isoparametric sub-domains having quadrilateralcross-sections, and each sub-domain is replaced by a grid of points which location depends on the adoptedintegration rule (Bontempi et al. 1996). In particular, depending on the function to be integrated and thegeometry of the problem, the Gauss-Legendre and the Gauss-Lobatto schemes are used (Figure 4).Dynamic Equilibrium Equations of the StructureThe equilibrium conditions of the <strong>finite</strong> <strong>beam</strong> <strong>element</strong> are derived from the already mentioned principle ofvirtual work. In this way, by assembling the <strong>element</strong> contributions with reference to a global coordinatesystem, the incremental dynamic equilibrium of the whole structure can be <strong>for</strong>mally expressed as follows:M d & s+ C ds&+ K ds= df(8)where s is the vector of the nodal displacements and f = f 0 +f 1 +f g is the vector of the nodal <strong>for</strong>ces. The latterresults from the nodal loads f 0 , the nodal <strong>for</strong>ces f 1 equivalent to the <strong>element</strong> loads f a = f a (x′), and the nodal<strong>for</strong>ces f g = −ü g Mi equivalent to the seismic actions due to the non-inertial acceleration ü g =ü g (t) of theground, and where i is the influence vector which components represent the nodal displacements <strong>for</strong> thestatic application of a unit ground displacement u g =1. Finally, the damping matrix C=C(t) is obtained ateach time instant from the modal properties of the structure according to the Rayleigh's model.5cr
Table 2. Stress σ = σ (ε ) and tangent modulus E = E (ε ) of the cyclic law d σ = Edεof concrete.∆ε > 0∆ε < 0P∈R⎧⎪σR+ ER( ε − εR)⎪3 2σ = ⎨Ax+ Bx + Cx + D⎪⎪ rεr⎪⎩r −1+ε⎧⎪ER⎪⎪ 2E = ⎨3Ax+ 2Bx+ C⎪r⎪r(r −1)(1− ε )⎪r 2⎩ ( r −1+ε )3424)3, ε ≤ ε ≤ εR, ε < ε ≤ ε3, ε > ε, εER+ E σ4−σA = + 2( ε − ε ( ε − ε343R4, ε < ε ≤ ε3, ε > ε334)ER+ 2E4σ4−σB = − − 3( ε − ε ) ( ε − εE R⎧σ3−σR⎪ ε3− εR= ⎨σR⎪⎪⎩εR− εcr, ε < εR324), εcr R 3≤ ε ≤ εcr34≤ ε ≤ ε434C =E 4D = σ 4x = ε − ε 4⎧ ⎛ rUx⎪σ⎜U1 −r⎪ ⎝ rU−1+ x⎪secσ = ⎨σ5+ E5( ε − ε5)⎪⎪⎪σcr⎩U⎞⎟⎠∗[ − λ ( ε − ε )]{(1− α ) exp+ α}⎧secrU( rU−1)(1− x⎪EUrU⎪ ( rU−1+x )⎪ secE = ⎨E5⎪⎪∗⎪−σcrλ(1 − α) exp⎩secE UσU=ε − εUE1= bcE 0rU=EUE−2UsecEUErU2)cr∗[ − λ ( ε − ε )]cr⎧ ϕE0⎪= ⎨ σ5⎪⎩ε5− ε2sec5,⎧b=⎨⎩c=maxminε − εUx =ε − ε2, ε ≤ ε ≤ ε2, ε ≤ ε ≤ ε5, ε < ε, ε < ε5, ε ≤ ε ≤ ε2, ε ≤ ε ≤ ε5{ kσ;1}5, ε = ε5ε < ε5U( −0.5){ ε ;1}UUcrcrU2U2P∉R⎧ ⎛ ε − ε ⎞R⎪σ⎜⎟R1−⎪ ⎝ ε6− εR ⎠⎪ ε − ε6σ = ⎨σ3⎪ ε3− ε6⎪ε − εR⎪σR+ ( σ3−σR)⎩ε3− εR⎧ σR⎪⎪εR− ε6⎪ σ3E = ⎨⎪ε3− ε6⎪σ3−σR⎪⎩ ε3− εR, ε ≤ ε6⎧ε> ε6, ⎨⎩εR≤ ε6⎧ε> ε6, ⎨⎩εR> ε6, ε ≤ ε6⎧ε> ε6, ⎨⎩εR≤ ε6⎧ε> ε6, ⎨⎩εR> ε6⎛σ = σ + ( − )⎜5σUσ51 −⎝ rE = EsecE UsecUrU( r( rUUσU− σ5=ε − εUE1= bcE 0rU=EUE−−1)(1− xrU−1+ x )5UsecEU2UrU)rUx−1+ x⎧b= max⎨⎩c= minUε − εUx =ε − εr U⎞⎟⎠{ k(σ −σ);1}U 5−0.5{(ε − ε ) ;1}5U5Numerical Integration of the Incremental Equations of MotionThe numerical solution of the non-linear incremental equations of motion is per<strong>for</strong>med at given time steps∆t by using the non-iterative <strong>for</strong>mulation of the Newmark's time-integration method. However, due to thenon-linear behaviour of the system, the secant matrices K=K(t) and C=C(t) are unknown. The dynamicequilibrium within each time step is then searched by subsequent approximations on the basis of theiterative Newton-Raphson technique.
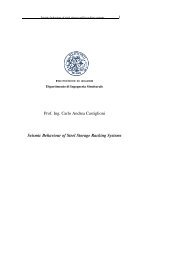
y'ηLobatto1z'y'-1-11ζLegendreηx'LobattoξLegendreFigure 4. Subdivision of the <strong>finite</strong> <strong>element</strong> volume in isoparametric sub-domains and locationsof the Gauss integration points according to the Legendre and Lobatto rules.MULTISCALE MEASURE OF STRUCTURAL DAMAGEStructural <strong>damage</strong> is here viewed as a degradation of the mechanical properties which makes the systemless able to withstand the applied actions. Damage models are usually based on state variables, or <strong>damage</strong>indicators, suitable to describe the <strong>damage</strong> state of the system. A direct measure of the <strong>damage</strong> is, instead,achieved through functions of such variables, called <strong>damage</strong> indices (CEB 1997).Damage IndicatorsA <strong>damage</strong> indicator d is usually identified with a meaningful parameter of the structural response. Inconcrete structures, <strong>damage</strong> is depending on several phenomena like cracking and crushing of theconcrete, yielding of the rein<strong>for</strong>cement, spalling of the concrete cover, buckling of the compressed bars,slip between concrete and steel, etc. Since all these aspects are generally strongly related to thepropagation of irreversible strains in the component materials, a minimum of two parameters representingthe maximum strain level and the dissipated energy, respectively, are usually required <strong>for</strong> a satisfactorydescription of the <strong>damage</strong> evolution. A first <strong>damage</strong> indicator d 1 is then identified with the maximumstrain ε max = ε max (x′, y′, z′, t) in the materials:⎧ − εc≥ 0 , concreted1≡ εmax= max ε = max ⎨(9)tt⎩ εs, steelwhere, because of its low tensile strength, only the compressive strain is considered meaningful <strong>for</strong> the<strong>damage</strong> of concrete. In addition, a <strong>damage</strong> indicator d 2 is chosen to be coincident with the strain energyΦ cyc = Φ cyc (x′, y′, z′, t) stored in the materials along the load path ℘:2≡ Φ =∫ σ dε℘dcyc(10)Damage IndicesA <strong>damage</strong> index D gives a direct measure of the <strong>damage</strong> level as a function of a set of <strong>damage</strong> indicators.The knowledge of such an index, usually defined within the range [0;1], allows to assess the distance ofthe actual structural configuration from each assigned limit state D = D . For a single <strong>damage</strong> indicator d,a relationship D = D(d) of wide generality can be introduced as follows (Powell & Allahabadi 1988):α−⎛ d − d ⎞D = ⎜ ⎟(11)+ −⎝ d − d ⎠where d − and d + represent the values of the variable d associated to the un<strong>damage</strong>d (D = 0) andcompletely <strong>damage</strong>d (D = 1) states, respectively, while α define the <strong>damage</strong> rate (Figure 5).
D1α10−d dd +dFigure 5. Relationship between a <strong>damage</strong> index D and a <strong>damage</strong> indicator d.For a set of q <strong>damage</strong> indicators d = [ d 1 d 2 … d q ] T , a relationship D = D(d) of wide generality canbe then introduced as follows (Biondini 2000):αq− rαq− r q1 ⎛ d ⎞ ⎛ ⎞r− drdr− drαr∑ w⎜ =+ −⎟ ∑⎜ =+ −⎟rr ∑ βrDr0 r=1 dr− drr=1 dr− drr=1D =β (12)w ⎝ ⎠ ⎝ ⎠where w r is the weight coefficient of the contribution D r associated to the indicator d r , d − r and d + r are thelimit values of d r associated to the un<strong>damage</strong>d (D r = 0) and completely <strong>damage</strong>d (D r = 1) states,respectively, α r is the corresponding <strong>damage</strong> rate, and w 0 = Σw r (r = 1,…, q). In particular, with referenceto the indicators d = [ d 1 d 2 ] T = [ ε max Φ cyc ] T previously introduced, a <strong>damage</strong> index of the materialsD M = D M (x′, y′, z′, t) is defined as follows:−α1−⎛ εmax− ε ⎞ ⎛ Φcyc− Φ= β ⎜ ⎟1+ β ⎜+ −2 + −α2⎞D ⎟M ⎜ ε ε ⎟ ⎜(13)⎝ − ⎠ ⎝ Φ − Φ ⎠This definition leads <strong>for</strong> α 1 = α 2 = 1, β 1 = 0, β 2 = β, and ε−= Φ−= 0 , to the widely accepted <strong>for</strong>mulationproposed by Park and Ang (1985). However, beside considering the threshold values ε − = Φ − = 0 <strong>for</strong> theinitial <strong>damage</strong>, the index of Park and Ang does not satisfy the following normalization condition:q∑r=1β = 1(14)rSuch inconsistency can be avoided by assuming β1 = (1 − βM) and β2= βM, or:−−εΦ − Φmax− εcycDM= ( 1 − βM) + β+ − M(15)+ −ε − ε Φ − Φwhere β M = β M (x′, y′, z′, t) denotes a suitable material constant (β M ≅ β), and the threshold values of theindicators are assumed to be coincident with the elastic and the ultimate limits in the materials:− ⎧ 0+ ⎧ − εcu, concreteε = ⎨⎩εε = ⎨sy⎩ εsu, steel ∫ −Φ − ε= σ dε0 ∫ +Φ + ε= σ d ε(16)0Multiscale Formulation of DamageThe index D M fully describes the <strong>damage</strong> evolution in each point of the structure. However, due to itslocal nature, it does not seem handy <strong>for</strong> design purposes. A more synthetic global measure of <strong>damage</strong>may be derived at different scales from D M by a weighted average over given portions of the structure. Bydenoting with w=w(x′, y′, z′, t′) a suitable weight function, which can be effectively identified with thestored energy w = Φ cyc (Wen 1986), it is useful to define a <strong>damage</strong> index of the cross-section D x = D x (x′, t):∫wDMdAADx= =∫ βxDMdA(17)Aw dA∫A
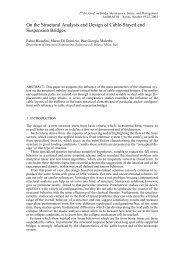
a <strong>damage</strong> index of the <strong>element</strong> Dk = Dk(t):∫Vk∫wDMdVDk==∫ βkDMdV(18)Vw dVkVkand a <strong>damage</strong> index of the structure D = D ) :m∑∫∑∫k = 10 0( twDMdVmVkk = 1D0 ==m ∑∫ β0DMdV(19)Vkk = 1w dVVkThe knowledge of both the time evolution and spatial distribution of such indices can be easily obtainedfrom a <strong>finite</strong> <strong>element</strong> analysis and leads to an accurate measure and a comprehensive vision of thestructural per<strong>for</strong>mance.APPLICATIONSRein<strong>for</strong>ced Concrete Column subjected to Cyclic Biaxial Bending and Axial ForceIn order to verify the capability of the proposed <strong>three</strong>-<strong>dimensional</strong> <strong>finite</strong> <strong>beam</strong> <strong>element</strong> in reproducing thecyclic response of rein<strong>for</strong>ced concrete systems under complex loading histories, the results of a series ofexperimental tests carried out by Bousias et al. (1995) are considered. The experimentation consists ofcyclic static tests on rein<strong>for</strong>ced concrete columns subjected to a vertical load and horizontal imposeddisplacements. In the present application, the tests denoted with S1, S5, S7, and S9 only are considered.All the columns have a free height h = 1.49 m and a square cross-section with side dimensiona = 250 mm (Figure 6.a). The rein<strong>for</strong>cement consists of 8∅16 mm longitudinal bars with concrete coverc = 15 mm, and stirrups ∅8 mm with spacing s = 70 mm. The steel material properties are: yielding strengthf sy = 460 MPa; ultimate strength f su = 710 MPa; ultimate strain ε su = 11%. The compression strength of concretevaries with the specimen: (S1) f c0 =29.0 MPa; (S5) f c0 =33.1 MPa; (S7) f c0 =28.1 MPa; (S9) f c0 =23.9 MPa.3For concrete the following properties are also specified:12 3E c 0= 9500 f c0, fct= 0.25fc0, ε c0 = 2%, ε cu = 4%.The components of the displacement at the top of the column and of the corresponding reaction<strong>for</strong>ce at its base are denoted with (u x ,u y ,u z ) and (F x ,F y ,F z ), respectively, where x and y are the horizontaldirections along the principal axes of the cross-section and z is the vertical direction along the axis of thecolumn. The displacement loading histories u x – u y are shown in Figure 7. As recalled in such Figure, thetests S1, S5, and S7 were carried out with a constant axial load ν =N/(f c0 a 2 ) = 0.12, while <strong>for</strong> the test S9two levels of axial load, ν = 0.03 and ν = 0.15, were applied during the experiment. Moreover, in order toavoid second order effects on the reaction <strong>for</strong>ce, the axial load was applied in such a way that its line ofaction passed at each time instant through the center of gravity of the column base.The column is modeled with 4 <strong>finite</strong> <strong>beam</strong> <strong>element</strong>s, each of them with 7 Gauss-Lobatto sections.The cross-section is subdivided in 13 isoparametric sub-domains, each of them characterized by adifferent level of confinement (Figure 6.b) and by an integration scheme which varies from 2×2 to 5×5Gauss-Legendre points (Figure 6.c), <strong>for</strong> a total of 93 sample points.Figures 8.a-b show the results of the analyses superimposed to those obtained from the experiments.In particular, the time-history of the vertical displacement u z =u z (t), the path of the horizontal reaction <strong>for</strong>cesF x -F y , and the horizontal load-displacement diagrams F x -u x and F y -u y , are reproduced in such Figures. In allcases, the comparison between numerical and experimental results is in general very good, even if minorsystematic deviations are noted in the initial branch of the first cycle of the load-displacement diagrams, aswell as along the reloading branches in correspondence of the sign inversion of the <strong>for</strong>ces, where the numericalhysteretic cycles tend to be a little wider than the experimental ones. Higher and not negligible deviationshowever occur during the last phases of the tests S5 and S9, which are characterized by a relevant strengthdegradation that is not detected by the numerical analyses. Since this is the only remarkable discrepancyamong analyses and experiments, it seems reasonable to correlate the strength degradation process with failuremechanisms which the <strong>finite</strong> <strong>beam</strong> <strong>element</strong> is not able to reproduce, as <strong>for</strong> example bond-slip and pull-outphenomena (Filippou 1998). Shear failures should be instead avoided due to the slenderness of the column.
2508φ16st.φ8/70012250 mm (a)(b)(c)Figure 6. Tested column. (a) Detail of the cross-section. (b) Subdivision in subdomains(0=no confinement; 1=low confinement; 2=high confinement). (c) Location of the Gauss points.S1S5ν=0.12ν=0.12ν=0.12S7S9ν=0.15ν=0.15ν=0.03ν=0.03Figure 7. Loading paths u x -u y of the cyclic tests S1, S5, S7, S9 (Bousias et al. 1995).Despite of the discrepancy mentioned above, <strong>for</strong> which additional failure mechanisms such asbond-slip should be included in the <strong>finite</strong> <strong>element</strong> <strong>for</strong>mulation, the results highlight the effectiveness ofthe <strong>finite</strong> <strong>beam</strong> <strong>element</strong> in reproducing the cyclic response of rein<strong>for</strong>ced concrete systems under complexloading histories. Thus, such <strong>element</strong> can be considered as a powerful tool both in static and seismic analysis ofrein<strong>for</strong>ced concrete structures, especially if joined to a proper measure of <strong>damage</strong>. With this regards, Figure9.a shows <strong>for</strong> the test S9 the time-history of the <strong>damage</strong> index D 0 =D 0 (t) of the whole structure, as well asthe diagram along the column axis of the <strong>damage</strong> index D x =D x (x′,t) of the cross-sections at different timeinstants. Such indices are evaluated by assuming a <strong>damage</strong> parameter β M =0.10 <strong>for</strong> both concrete and steel.It can be noticed that the <strong>damage</strong> index D x =D x (x′,t) of the cross-section gives an effective description ofthe spatial distribution of <strong>damage</strong>, which, during time, obviously tends to localize at the bottom part of thecolumn. At an higher level, the index D 0 =D 0 (t) gives instead a more synthetic measure of <strong>damage</strong>, which isdirectly related to the per<strong>for</strong>mance of the whole structural system. This is highlighted in Figure 9.b, whichshows the time-history of the first vibration period T=T(t) of the column. Due to the evolution of <strong>damage</strong>,the vibration period T progressively increases during the test with step increments that, on average, areclearly related to the variation of the <strong>damage</strong> rate, represented by the slope of the curve in Figure 9.a.
S1S5Figure 8-a. Comparison of experimental (dashed lines) and numerical results (continuous lines):time history u z =u z (t), path of the reaction <strong>for</strong>ces F x -F y , load-displacement diagrams F x -u x and F y -u y .
S7S9Figure 8-b. Comparison of experimental (dashed lines) and numerical results (continuous lines):time history u z =u z (t), path of the reaction <strong>for</strong>ces F x -F y , load-displacement diagrams F x -u x and F y -u y .
D x(a)(b)Figure 9. (a) Time-history of the <strong>damage</strong> index D 0 =D 0 (t) of the structure, and diagrams of the <strong>damage</strong> indexD x =D x (x′,t) of the cross-sections at different time instants. (b) Time-history of the first vibration period T = T(t).Seismic Analysis of a Concrete Bridge StructureThe concrete bridge shown in Figure 10 is considered. The bridge deck is a two-box girder having totallength l = 200 m and monolithic connections with both the piers and the abutments. The cross-section ofthe deck is shown in Figure 11.a. The piers, having the same height h = 40 m, are subdivided into twoparts. The lower one has a box cross-section while the upper part is composed by the two main edges ofthe box rigidly connected only at the top. The higher-flexibility of the upper zone of the piers allows <strong>for</strong>the horizontal displacements due to the time dependent effects and to the temperature-imposed de<strong>for</strong>mations.Moreover, by varying the height h 1 of the stiffer part, the seismic behavior of each pier, and then of thewhole bridge, can be properly modified to optimize the structural per<strong>for</strong>mance. This was done in previousworks where an optimal solution with h 1 = 0.70h <strong>for</strong> the lateral piers and h 1 = 0.40h <strong>for</strong> the central pierwas selected within a design strategy of <strong>damage</strong> minimization (Biondini 2000, Biondini et al. 2000). Thegeometry of the box cross-section of the piers, as well as the rein<strong>for</strong>cement layout, are given in Figure 11.b.Such cross-section is modeled as shown in Figure 11.c. The basic material properties are: f c0 = 30 MPa,3ε c0 = 2%, ε cu = 4%,12 3E c 0= 9500 f c0, and fct= 0.25fc0<strong>for</strong> concrete; f sy = 460 MPa and ε su = 11% <strong>for</strong>rein<strong>for</strong>cing steel. A <strong>damage</strong> parameter β M = 0.10 is assumed <strong>for</strong> both concrete and steel. The weightdensity of the composite material is γ =ρ g = 25 kN/m 3 . The damping ratio is assumed to be ξ = 5%. Sincethe non-linear behavior of the piers is mainly of interest, <strong>for</strong> the deck a linear elastic behavior with ahigher damping ratio ξ = 15% is assumed. Finally, the soil-structure interaction is accounted <strong>for</strong> by elasticsprings having stiffness as listed in Table 3. The structural model is finally shown in Figure 12.The ground motion considered <strong>for</strong> the seismic analysis is described by an artificial accelerogramü g = ü g (t) having duration of 25 sec and peak value of 0.40g. The vertical component of the groundmotion is disregarded and the direction d=d(t) of the earthquake is defined by the horizontal angleθ = θ (t) <strong>for</strong>med with the bridge axis (Figure 12). In particular, the four seismic scenarios associated to theconstant values θ = 0÷30÷60÷90° are investigated.The structural per<strong>for</strong>mance of the bridge with respect to the selected earthquakes can be appreciatedfrom Figure 13, which shows the time-histories of the <strong>damage</strong> index D 0 = D 0 (θ, t) of the whole structure.First, it can be noticed that the direction of the earthquake strongly influences the development process of<strong>damage</strong>. In fact, <strong>for</strong> θ = 0° <strong>damage</strong> tends to fully take place around the time instant t ≅ 11 sec, while <strong>for</strong>higher θ–values <strong>damage</strong> develops in wider time intervals, up to about ∆t ≈ 10 sec <strong>for</strong> θ = 90°. Second, themore demanding scenario is associated to θ = 90°, <strong>for</strong> which the maximum final <strong>damage</strong> is achieved.However, in all cases the level of global <strong>damage</strong> is quite similar and remains very low (D 0,max = 0.03),denoting a good seismic per<strong>for</strong>mance of the whole structural system.An effective description of the spatial distribution of <strong>damage</strong> is also given in Figure 14, where thediagrams of the cross-sectional <strong>damage</strong> index D x = D x (x′,t) in the piers at equally spaced time intervals are
50200 m50 50 5040 mFigure 10. Schematic view and main dimensions of the concrete bridge.cm(a)(b)(c)Figure 11. (a) Geometrical dimensions of the deck cross-section. Cross-section of the bottom partof the piers: (b) geometrical dimensions and rein<strong>for</strong>cement layout; (c) <strong>finite</strong> <strong>element</strong> model.
zx04yzzydθxh0.70h0.70h0.40h1 2 3Figure 12. Structural model of the bridge.Table 3. Elastic stiffness of the springs at the base of the structure.Horizontal[MN/m]Vertical[MN/m]Rotational x[MNm]Rotational z[MNm]Torsional[MNm]Foundations 3000 15000 300000 400000 200000Abutments 3000 15000 400000 300000 200000Figure 13. Time-history of the structural <strong>damage</strong> index D 0 <strong>for</strong> θ = 0÷30÷60÷90° (D 0,max = 0.03).presented. Such diagrams show that <strong>for</strong> θ = 90° the piers tend to behave like cantilever <strong>beam</strong>s and thesectional <strong>damage</strong> distribution results quite regular. However, as the θ−angle decreases, the internalredundancy of the piers gradually develops and their behavior becomes progressively more complex,leading to less regular <strong>damage</strong> distributions. Anyway, the maximum level of <strong>damage</strong> remains still verylow, even <strong>for</strong> the worst case θ = 0° (D x,max = 0.054).Finally, additional and more detailed in<strong>for</strong>mation about the local <strong>damage</strong> is presented in Figure15, which shows the maps of the <strong>damage</strong> index of the materials D M = D M (x′,y′,z′,t) in the cross-section atthe base of the middle pier at the end of the earthquakes. Such maps, which allow to fully appreciate thedirectionality effects of the seismic actions, highlight some peaks of <strong>damage</strong> localized in the unconfinedconcrete of the cover, especially <strong>for</strong> θ = 90° (D M,max = 0.180).
θ = 0° θ = 30° θ = 60° θ = 90°Figure 14. Diagrams of the cross-sectional <strong>damage</strong> index D x <strong>for</strong> the left and central piers<strong>for</strong> θ = 0÷30÷60÷90° at different time instants (∆t = 2 sec; D x,max = 0.054).θ = 0° θ = 30° θ = 60° θ = 90°Figure 15. Maps of the material <strong>damage</strong> index D M <strong>for</strong> the cross-section at the base of thecentral pier <strong>for</strong> θ = 0÷30÷60÷90° at the end of earthquakes (t = 25 sec; D M,max = 0.180).CONCLUSIONSThe <strong>for</strong>mulation of a <strong>three</strong>-<strong>dimensional</strong> rein<strong>for</strong>ced concrete <strong>finite</strong> <strong>beam</strong> <strong>element</strong> which considers bothmechanical non-linearity, associated with the cyclic constitutive properties of the materials, and geometricalnon-linearity, due to the second order effects, has been proposed. The structural hysteretic behavior isreproduced at the material level by means of proper cyclic constitutive laws of concrete and steel, which takealso some local phenomena of interaction between them into account. For concrete, the model includescracking and crushing, tension stiffening, confinement passive action of the stirrups and spalling of theconcrete cover. For rein<strong>for</strong>cing steel, the model accounts <strong>for</strong> yielding, kinematic-isotropic hardening, saturationand memory of the plastic strains, and buckling of the bars. Prestressing can be also easily included.It is worth noting that the presented <strong>finite</strong> <strong>element</strong> is different from the so-called fiber <strong>element</strong>s,since the numerical integration is per<strong>for</strong>med by higher order rules. In fact, in fiber <strong>element</strong>s the concretecross-section is subdivided in small square areas (the fibers) and the function to be integrated is evaluatedin their center of gravity. Within each fiber, such scheme is then equivalent to a one-point Newton-Cotesintegration rule. On the contrary, in the <strong>element</strong> here proposed the concrete cross-section is subdivided inisoparametric sub-domains having quadrilateral cross-sections. Each sub-domain is then replaced by a gridof points which location is chosen according to the Gauss-Legendre or the Gauss-Lobatto integration rule.Such scheme has two main advantages. First, the use of quadrilateral isoparametric sub-domains allows asimpler and more accurate modeling of the geometry of complex cross-sectional shapes. Second and most
important, <strong>for</strong> a given number of integration points the Gauss rules leads to a higher accuracy if comparedwith the Newton-Cotes scheme, the more as the number of integration points increases.The <strong>for</strong>mulation has been also extended to endow the <strong>finite</strong> <strong>element</strong> with an effective model of<strong>damage</strong> evaluation. In particular, a suitable set of <strong>multiscale</strong> <strong>damage</strong> indices defined at the material leveland, progressively, at the sectional level, at the <strong>element</strong> level, and at the structural level, has been introduced.Such a measure of structural per<strong>for</strong>mance is consistent with the philosophy of the modern seismic codes,where the design requirements are specified in terms of acceptable levels of structural <strong>damage</strong>.The <strong>finite</strong> <strong>element</strong> has been validated with reference to a series of experimental static tests onrein<strong>for</strong>ced concrete columns subjected to cyclic biaxial bending and axial load. Despite of some discrepanciesrelated to failure mechanisms, such as bond-slip, not considered in the proposed <strong>for</strong>mulation, the successfulcomparison of numerical and experimental results proves the effectiveness of the <strong>finite</strong> <strong>element</strong> inreproducing the cyclic response of rein<strong>for</strong>ced concrete systems under complex loading histories. Thiscandidates such <strong>element</strong> as a powerful tool <strong>for</strong> both static and seismic non-linear analysis of rein<strong>for</strong>cedconcrete structures, especially if joined to a proper measure of <strong>damage</strong>, as proposed in the present work.This has been also highlighted with a final application to the seismic analysis of a concrete bridge, <strong>for</strong>which an accurate measure and a comprehensive vision of the structural per<strong>for</strong>mance is achieved.ACKNOWLEDGEMENTSThe author wishes to thank Prof. Stathis Bousias who provided the database of the experimental results.REFERENCES1. Biondini, F., Strutture da ponte soggette ad azioni di tipo sismico. Modellazione ed ottimizzazione. PhDDissertation, Department of Structural Engineering, Politecnico di Milano, 2000 (in Italian).2. Biondini, F., Martinez y Cabrera, F., Parisi, M.A., Optimization of Bridge Structures under Seismic Actions.Proc. of 3 rd Int. PhD Symposium in Civil Engineering, Vienna, October 5–7, 2000.3. Bolong, Z., Mingshun, W., Kunlian, Z., A Study of Hysteretic Curve of Rein<strong>for</strong>ced Concrete Member Under CyclicLoading. Proc. of the 7 th World Conf. on Earthquake Engineering (WCEE), September 8-13, Instanbul, 6, 509-517, 1980.4. Bontempi, F., Malerba, P.G., Romano, L., Formulazione diretta secante dell’analisi non lineare di telai in C.A./C.A.P.,Studi e Ricerche, Graduate School <strong>for</strong> Concrete Structures, Politecnico di Milano, 16, 351-386, 1995 (in Italian).5. Bousias, S.N., Verzeletti, G., Fardis, M.N., Gutierrez, E., Load-Path Effect in Column Biaxial Bending withAxial Force. ASCE Journal of Engineering Mechanics, 121(5), 596-605, 1995.6. CEB, Seismic Design of Rein<strong>for</strong>ced Concrete Structures <strong>for</strong> Controlled Inelastic Response. Bulletin 236, 240, 1997.7. Filippou, F., Simulation of Hysteretic Behavior of RC Columns, Proc. of Structural Engineers World Congress(SEWC), Paper T153-3, San Francisco, July 18-23, 1998.8. Giuffrè, A., Pinto, P.E., Il comportamento del cemento armato per sollecitazioni cicliche di <strong>for</strong>te intensità.Giornale del Genio Civile, 5, 391-408, 1970 (in Italian).9. Goldberg, J.E., Richard, R.M., Analysis of Nonlinear Structures. ASCE J. of the Struct. Division, 89(4), 333-351, 1963.10. Malerba, P.G. (Ed.), Analisi limite e non lineare di strutture in cemento armato. CISM, Udine, 1998 (in Italian).11. Mander, J.B., Priestley, M.J.N., Park, R., Theoretical Stress-Strain Model <strong>for</strong> Rein<strong>for</strong>ced Concrete. ASCEJournal of Structural Engineering, 114(8), 1804-1826, 1988.12. Menegotto, M., Pinto, P.E., Method of Analysis <strong>for</strong> Cyclically Loaded Rein<strong>for</strong>ced Concrete Plane Frames IncludingChanges in Geometry and Non-Elastic Behavior of Elements Under Combined Normal Force and Bending. Resistanceand Ultimate De<strong>for</strong>mability of Structures Acted on by Well-Defined Repeated Loads, IABSE Symposium, 15-22, 1973.13. Monti, G., Nuti, C., Nonlinear Cyclic Behavior of Rein<strong>for</strong>cing Bars Including Buckling. ASCE Journal ofStructural Engineering, 118(12), 3268-3284, 1992.14. Park, Y.-J., Ang, A.H.-S., Mechanistic Seismic Damage Model <strong>for</strong> Rein<strong>for</strong>ced Concrete. ASCE Journal ofStructural Engineering, 111(4), 722-739, 1985.15. Popovics, S., A Numerical Approach to the Complete Stress-Strain Curve of Concrete. Cement and ConcreteResearch, 3, 583-599, 1973.16. Powell, G.H., Allahabadi, R., Seismic Damage Prediction by Deterministic Methods: Concepts and Procedures.Earthquake Engineering and Structural Dynamics, 16, 719-734, 1988.17. Stevens, N.J., Uzumeri, S.M., Collins, M.P., Analytical Modelling of Rein<strong>for</strong>ced Concrete Subjected toMonotonic and Reversed Loadings. Department of Civil Engineering, University of Toronto, 87(1), 1987.18. Wen, Y.-K., Stochastic Response and Damage Analysis of Inelastic Structures. Probabilistic EngineeringMechanics, 1(1), 49-57, 1986.