On slope instability induced by seepage erosion - Ingegneria ...
On slope instability induced by seepage erosion - Ingegneria ...
On slope instability induced by seepage erosion - Ingegneria ...

You also want an ePaper? Increase the reach of your titles
YUMPU automatically turns print PDFs into web optimized ePapers that Google loves.
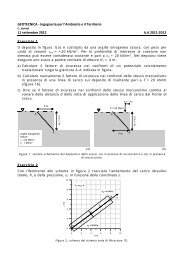
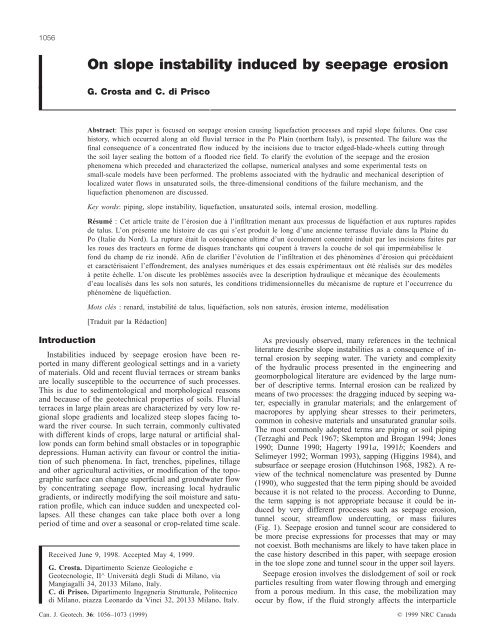
1056<strong>On</strong> <strong>slope</strong> <strong>instability</strong> <strong>induced</strong> <strong>by</strong> <strong>seepage</strong> <strong>erosion</strong>G. Crosta and C. di PriscoAbstract: This paper is focused on <strong>seepage</strong> <strong>erosion</strong> causing liquefaction processes and rapid <strong>slope</strong> failures. <strong>On</strong>e casehistory, which occurred along an old fluvial terrace in the Po Plain (northern Italy), is presented. The failure was thefinal consequence of a concentrated flow <strong>induced</strong> <strong>by</strong> the incisions due to tractor edged-blade-wheels cutting throughthe soil layer sealing the bottom of a flooded rice field. To clarify the evolution of the <strong>seepage</strong> and the <strong>erosion</strong>phenomena which preceded and characterized the collapse, numerical analyses and some experimental tests onsmall-scale models have been performed. The problems associated with the hydraulic and mechanical description oflocalized water flows in unsaturated soils, the three-dimensional conditions of the failure mechanism, and theliquefaction phenomenon are discussed.Key words: piping, <strong>slope</strong> <strong>instability</strong>, liquefaction, unsaturated soils, internal <strong>erosion</strong>, modelling.Résumé : Cet article traite de l’érosion due à l’infiltration menant aux processus de liquéfaction et aux ruptures rapidesde talus. L’on présente une histoire de cas qui s’est produit le long d’une ancienne terrasse fluviale dans la Plaine duPo (Italie du Nord). La rupture était la conséquence ultime d’un écoulement concentré induit par les incisions faites parles roues des tracteurs en forme de disques tranchants qui coupent à travers la couche de sol qui imperméabilise lefond du champ de riz inondé. Afin de clarifier l’évolution de l’infiltration et des phénomènes d’érosion qui précédaientet caractérisaient l’effondrement, des analyses numériques et des essais expérimentaux ont été réalisés sur des modèlesà petite échelle. L’on discute les problèmes associés avec la description hydraulique et mécanique des écoulementsd’eau localisés dans les sols non saturés, les conditions tridimensionnelles du mécanisme de rupture et l’occurrence duphénomène de liquéfaction.Mots clés : renard, instabilité de talus, liquéfaction, sols non saturés, érosion interne, modélisation[Traduit par la Rédaction] Crosta and di Prisco 1073IntroductionInstabilities <strong>induced</strong> <strong>by</strong> <strong>seepage</strong> <strong>erosion</strong> have been reportedin many different geological settings and in a varietyof materials. Old and recent fluvial terraces or stream banksare locally susceptible to the occurrence of such processes.This is due to sedimentological and morphological reasonsand because of the geotechnical properties of soils. Fluvialterraces in large plain areas are characterized <strong>by</strong> very low regional<strong>slope</strong> gradients and localized steep <strong>slope</strong>s facing towardthe river course. In such terrain, commonly cultivatedwith different kinds of crops, large natural or artificial shallowponds can form behind small obstacles or in topographicdepressions. Human activity can favour or control the initiationof such phenomena. In fact, trenches, pipelines, tillageand other agricultural activities, or modification of the topographicsurface can change superficial and groundwater flow<strong>by</strong> concentrating <strong>seepage</strong> flow, increasing local hydraulicgradients, or indirectly modifying the soil moisture and saturationprofile, which can induce sudden and unexpected collapses.All these changes can take place both over a longperiod of time and over a seasonal or crop-related time scale.Received June 9, 1998. Accepted May 4, 1999.G. Crosta. Dipartimento Scienze Geologiche eGeotecnologie, II^ Università degli Studi di Milano, viaMangiagalli 34, 20133 Milano, Italy.C. di Prisco. Dipartimento <strong>Ingegneria</strong> Strutturale, Politecnicodi Milano, piazza Leonardo da Vinci 32, 20133 Milano, Italy.Can. J. Geotech. 36: 1056–1073 (1999)As previously observed, many references in the technicalliterature describe <strong>slope</strong> instabilities as a consequence of internal<strong>erosion</strong> <strong>by</strong> seeping water. The variety and complexityof the hydraulic process presented in the engineering andgeomorphological literature are evidenced <strong>by</strong> the large numberof descriptive terms. Internal <strong>erosion</strong> can be realized <strong>by</strong>means of two processes: the dragging <strong>induced</strong> <strong>by</strong> seeping water,especially in granular materials; and the enlargement ofmacropores <strong>by</strong> applying shear stresses to their perimeters,common in cohesive materials and unsaturated granular soils.The most commonly adopted terms are piping or soil piping(Terzaghi and Peck 1967; Skempton and Brogan 1994; Jones1990; Dunne 1990; Hagerty 1991a, 1991b; Koenders andSelimeyer 1992; Worman 1993), sapping (Higgins 1984), andsubsurface or <strong>seepage</strong> <strong>erosion</strong> (Hutchinson 1968, 1982). A reviewof the technical nomenclature was presented <strong>by</strong> Dunne(1990), who suggested that the term piping should be avoidedbecause it is not related to the process. According to Dunne,the term sapping is not appropriate because it could be <strong>induced</strong><strong>by</strong> very different processes such as <strong>seepage</strong> <strong>erosion</strong>,tunnel scour, streamflow undercutting, or mass failures(Fig. 1). Seepage <strong>erosion</strong> and tunnel scour are considered tobe more precise expressions for processes that may or maynot coexist. Both mechanisms are likely to have taken place inthe case history described in this paper, with <strong>seepage</strong> <strong>erosion</strong>in the toe <strong>slope</strong> zone and tunnel scour in the upper soil layers.Seepage <strong>erosion</strong> involves the dislodgement of soil or rockparticles resulting from water flowing through and emergingfrom a porous medium. In this case, the mobilization mayoccur <strong>by</strong> flow, if the fluid strongly affects the interparticle© 1999 NRC Canada
Crosta and di Prisco 1057Fig. 1. Sketches of possible mechanisms at the origin of sapping, tunnel scouring, and <strong>seepage</strong> <strong>erosion</strong> according to definitionscommonly found in the literature.© 1999 NRC Canada
1058 Can. J. Geotech. Vol. 36, 1999frictional strength, or <strong>by</strong> the shear failure of the continuum(Fig. 1). The latter is likely on steep <strong>slope</strong>s where <strong>seepage</strong><strong>erosion</strong> may trigger or evolve into mass movement. Seepage<strong>erosion</strong> can advance easily in soils (Jones 1990) with macroporesalong which water flow occurs and where a conspicuouswater supply (intermittent or continuous) and wellconcentratedwater infiltrations take place.Tunnel scour occurs when water enters a hole or crackwithin or at the surface of a soil deposit. The original conduit(Fig. 1) may be due to biogenic factors or tensile crackingalong the margins of gullies and landslide blocks,shrinkage in clay-rich soils, <strong>seepage</strong> <strong>erosion</strong>, or human activity.This paper illustrates a case history from the Po Plain ofnorthern Italy which is characterized <strong>by</strong> the following phenomena:<strong>seepage</strong> <strong>erosion</strong>, tunnel scouring, landslides, andliquefaction processes. The difficulty of interpreting the phenomenonis due to (i) its complex time sequence, (ii) itsthree-dimensional (3D) geometry, (iii) the unsaturated conditionsof collapsed materials, and (iv) liquefaction of the soilstrata. To clarify the phenomenon, the authors used standardgeotechnical design methods. Numerical programs and physicalmodels have been used to study flow localizationthrough unsaturated soils and to interpret the occurrence ofthe failure mechanism and its particular geometrical shape.Case historyGeological and geomorphological settingThis paper presents a case history of a failure which occurredat Groppello in the central Po Plain near the town ofPavia (Lombardy, Fig. 2) and the confluence of the Ticinoand Po rivers. In this area the boundaries of the Ticino Riverterraces are oriented in a east–west direction. The depositsforming the terraces are fluvial sediments from the recentPleistocene “diluvium,” mainly consisting of interlayeredsand, silt, and clay strata with occasional gravel. The presentTicino River bed is characterized <strong>by</strong> alluvial sandy gravelfrom the intermediate Holocene “alluvium.”The fluvial terraces exhibit flat top surfaces. The upperedge of the alluvial terrace is located at 89 m above sea level(asl), coinciding with the general elevation of the Po Plain.The terrace is bounded <strong>by</strong> a 20 m high, densely vegetated<strong>slope</strong> with an average inclination of 35° (Figs. 3a, 4). Thetoe of the <strong>slope</strong> is located on the edge of a lower alluvial terrace,at an elevation of 69 m as1. Both terraces are characterized<strong>by</strong> extremely low gradients, generally less than 1%.The upper terrace is used for rice and corn crops. A ricefield is located close to the <strong>slope</strong> failure in which a waterlevel of 20 cm depth was maintained at the time of the event<strong>by</strong> a system of interconnected ponds. Small concavitiesprobably representing the trace of old slides or <strong>erosion</strong> featurescan be observed.The original morphology has been slightly reworked <strong>by</strong>human activity. Agriculture is among the most important activitiesin the area. The commonly encountered rice fieldsare filled for 3 months per year but there are also corn crops.Description of the phenomenaThe Groppello <strong>slope</strong> failure took place between June 27and 28, 1993, along the upper terrace of the west bank of theFig. 2. Location map of the studied areas.Ticino River (Fig. 2). Interest in the phenomenon was due tothe presence of a pipeline running from Genoa to Milan.Economic damage to the rice crops was low and therefore ofsecondary importance.Rainfall was very limited during June 1993, even thoughprecipitation occurred just before the event. Moderate rainfallrecorded on June 23 and 24 (15 mm at Bereguardo,31 mm at Mortara, and 49.2 mm at Pavia) had a return periodof less than 2 years according to the statisticalGumbel’s method.The <strong>slope</strong> failure resulted in the formation of a bottleneckshapedgully (Figs. 3, 4). The maximum depth was about10 m, with a subcircular depletion area subdivided <strong>by</strong> narrowridges into three small secondary basins (Fig. 3a, 4).The intermediate zone was characterized <strong>by</strong> a narrow V-shaped channel (Fig. 3b) which started almost tangential tothe upper depletion area. The channel was almost 25 m long,with steep flanks (40°) and a longitudinal profile with an averageinclination of 6°, varying between 3° and 18°.At the base a large symmetrical cone almost 100 m inlength had formed (Fig. 4). The average cone inclinationranged between 1° and 3° (light grey shaded area in Fig. 4);the steeper apex (6°–8°; dark grey shaded area in Fig. 4) extendedup to 23 m from the channel outlet. The cone wascharacterized <strong>by</strong> a maximum width of 80 m at a distance of20 m from the channel outlet, along a preexisting ditch. Theaverage width was 60 m. Reeds growing on the lower terracewere only obliterated within 30 m of the channel outlet,while farther away no disturbance was observed.The existing pipeline, placed at an average depth of0.95 cm below the upper terrace tread, is subparallel to thechannel axis. It is about 7 m from the depletion area and almost45 m from the channel at the base of the <strong>slope</strong> (Fig. 4).The geometric and morphological features of theGroppello <strong>slope</strong> failure are similar to those of the rapidevent which occurred at Sairano in 1980 (Fig. 2). This eventoccurred along a vegetated terrace <strong>slope</strong> with a rice field atthe top and involved a 1.5 m deep pipeline. The terrace was10 m high with an average <strong>slope</strong> of 32° (Figs. 5, 6a). Thefailure surface had a maximum length of 50 m and amaximum depth of 7 m (Fig. 5). The narrow and elongatedchannel had an average <strong>slope</strong> ranging between 4° and 6°.Unlike the previous case, the pipeline was parallel to the<strong>slope</strong> and directly affected <strong>by</strong> the depletion zone. The Sairano© 1999 NRC Canada
Crosta and di Prisco 1059Fig. 3. Photographs of the Groppello area after the <strong>slope</strong> failure. (a) Aerial view. (b) Outward view of the V-shaped gully. (c) Scaroriginated as a consequence of the 1993 event at Groppello and view of the soil profile with a large conduit (pipe). The location wherea tractor wheel track cut through the impervious bottom of the rice field can be seen just above the pipe. The pipe is located close totheDPSH1siteinFig.4.(d) Two superficial incisions above pipes and about 2 m apart close to the DPSH 1 site.event was very rapid, as indicated <strong>by</strong> damage to cars andbuildings at the toe of the <strong>slope</strong> (Fig. 6b).Soil stratigraphyStratigraphy, thickness, and lateral extent of the soil strataare the main controlling factors with regard to piping andsoil liquefaction phenomena. Therefore, particular attentionwas paid to obtain a precise description of soil features andtheir changes along the profile. The stratigraphy exposedalong the main scarp caused <strong>by</strong> the <strong>slope</strong> failure was subsequentlychecked <strong>by</strong> one vertical sounding (Fig. 4) and twodynamic probing super heavy penetrometric tests (Meardi’s© 1999 NRC Canada
1060 Can. J. Geotech. Vol. 36, 1999Fig. 4. Sketch representing the geometry of the Groppello event, with location of in situ tests, the main <strong>erosion</strong> pipes, and the pipeline.DPSH, Meardi dynamical probing super heavy penetrometer.DPSH; weight 73.5 kg, penetration length 30 cm, diameter34 mm).Figures 7 and 8 show a representative stratigraphic profileof the site which summarizes the information obtained fromfield and borehole survey and laboratory tests. The observedsequence, starting from the surface, consists of alluvial depositswith a wide range of grain sizes (Fig. 9a).A30cmthick layer of organic topsoil forms a seal at the surface ofthe rice field. The underlying 70 cm sandy layer consists ofa finer grained upper half, with ochre and brownish oxidation,and a lower half which is colourless. The colourlesszones demonstrate the occurrence of water <strong>seepage</strong> throughthem. Below this stiff silty layer, cross-laminated cleansands are present with subangular to subrounded quartz andfeldspar grains, with subordinate micas (Figs. 9a, 9b).Within the channel, close to the terrace edge, the strata previouslyidentified in the depletion zone are substituted <strong>by</strong> alight brown silty sand soil, possibly a result of <strong>erosion</strong> andweathering of the previously described materials.Some stratigraphic observations were conducted withinthe accumulation zone along a small trench. Bedding wasmore evident in the upper part of the deposit, gently dippingin the direction of flow as indicated <strong>by</strong> alternating fine andslightly coarser sand layers.Geotechnical characterizationSampling and soundingA series of disturbed and undisturbed soil samples wascollected along the main failure scarp just after the event(Fig. 8). Hydraulic and geotechnical properties of the soillayers were determined and are summarized in Fig. 8 andTable 1. Three more samples have been collected from thechannel flanks and one sample from the accumulation area.The single borehole located 30 m from the scar (Fig. 4), atthe terrace edge and on the opposite side of the pipeline,shows a stratigraphic sequence similar to that in the failurezone. The groundwater table was at a depth of 20 m belowthe level of the upper terrace. In situ tests consisted of threeLefranc permeability tests within the borehole and two penetrometrictests (DPSH) (Fig. 8). The Lefranc variable-headtests (CIRIA 1986) were conducted only in the silty layers.© 1999 NRC Canada
Crosta and di Prisco 1061Fig. 5. Sketch representing the geometry of the 1980 Sairano event, with location of the main <strong>erosion</strong> pipes and the pipeline.Soil propertiesThe area is characterized <strong>by</strong> fine sandy soils intercalatedwith silt to silty clay layers (Figs. 9a, 9b). Physical properties,from grain-size analyses and identification tests, are reportedin Table 1 and Fig. 8. The saturated hydraulicconductivity values computed using the formula of Hazen(1911) for well-sorted soils and the strength parameters obtainedfrom direct shear, torsional shear, and triaxial tests arereported in Table 1. Undisturbed samples were taken fromthe silt and silty clay type deposits, whereas for sand, reconstructedsamples were prepared and tested at the in situ density.Standard isotropically consolidated undrained triaxialtests (CIU) were performed on 100 mm diameter sand specimens.Samples collected from the upper finer sand layer were characterized<strong>by</strong> a higher water content (27.7–29.5%) comparedwith those from the lower, coarser sand layer (4.8–6.0%). Thein situ void ratio for the lower sand layer (American Societyfor Testing and Materials (ASTM) standards D4253 andD4254) ranged between 0.80 and 0.92, and the minimum andmaximum void ratios ranged between 0.59 and 0.66 and 1.00and 1.11, respectively. The in situ relative density (Dr) valuesranged between 39 and 63%, with a minimum value 6.3 m belowthe surface.The material from the flanks of the outlet channel is characterized<strong>by</strong> a lower water content (2.7–5.5%) and a slightlyhigher void ratio (0.82–0.94). This could be the result of ahigher content of fine particles due to weathering and abrasion.The deposit had a maximum water content of 7.6%with a relatively high void ratio of 0.94 and a low dry unitweight (13.8 kN/m 3 ) in comparison with those of the materialfrom the channel flanks.According to laboratory and in situ tests the materials involvedin the event are medium- to fine-grained silty sands(D50 ranging between 0.01 and 0.31, uniformity coefficient(UC) between 1.4 and 10, and Dr between 17 and 75%). Theobserved grain size and bottleneck-shaped gully, with a largesubcircular depletion area, narrow channel, and large accumulationfan, are often described as characteristic of liquefactionphenomena (Casagrande 1936; Koppejan et al. 1948;Eckersley 1985).More difficult is the comparison of the grain-size valuesreported here with those from the literature. Hutchinson(1982) reported that materials prone to <strong>seepage</strong> <strong>erosion</strong> aregranular fine sands with a D50 ranging between 0.09 and0.25 mm and a uniformity coefficient ranging between 1.8and 3.1. This is one of the few references with quantitativesoil data together with those concerning the filter properties© 1999 NRC Canada
1062 Can. J. Geotech. Vol. 36, 1999Fig. 6. Photographs of the 1980 Sairano event, showing location of an <strong>erosion</strong> pipe just parallel to the pipeline (a) and the depositionarea (b).Fig. 7. Cross section of the fluvial terrace as obtained from field surveys. Erosion pipes are located along the profile, and theirpositions are evident under the incisions made <strong>by</strong> tractor wheels.© 1999 NRC Canada
© 1999 NRC CanadaFig. 8. Stratigraphic profile obtained <strong>by</strong> combining data from in situ investigations (borehole and penetration testing) and a detailed survey of the scarp walls. The results oflaboratory and in situ tests are also summarized. c′, cohesion; CU, uniformity coefficient; dist. and undist., disturbed and undisturbed, respectively; e, void index; i critical , criticalhydraulic gradient; k, hydraulic conductivity; k Lefranc , hydraulic conductivity from Lefranc variable-head tests; w n , natural water content; s, sample number; γ n , natural unitweight; γ d , dry unit weight; φ′, internal friction angle; Pt, point; Rev, revetment.Crosta and di Prisco 1063
© 1999 NRC CanadaTable 1. Summary of physical and mechanical properties of the samples from Groppello and Sairano.SampleNo.Depth (m)DPSHγ d(blows)* k (cm/s) † (kN/m 3 )Void index eDr(%) Max. Min.Insituw n(%)c(kN/m 2 ) φ ′ (°)φ′DPSH(°)USCS ‡Grain-size parameters (mm)CU(D60/D10) D10 D15 D50 D60 D85§i criticalGroppello0g 0.30 7 1.00×10 –4 — 17.4 — — — — — 24 16.00 0.01 0.02 0.14 0.16 0.30 —1a 0.50 7 1.21×10 –4 16.7 28 — 0.617 — — — 27 11.82 0.01 0.02 0.10 0.13 0.31 1.841g 0.70 7 3.60×10 –3 15.8 30 — 0.687 15.2 29 2.67 0.06 0.08 0.15 0.16 0.20 1.022ag 0.93 7 3.03×10 –5 — 35 — — 29.5 — — 31 4.55 0.01 0.01 0.02 0.03 0.06 —2 1.00 7 3.03×10 –5 — 55 — — — — — 30 S 4.55 0.01 0.01 0.02 0.03 0.06 —2c 1.00 7 1.69×10 –2 — 31 0.962 0.580 — 27.7 — — 30 SP 2.69 0.13 0.16 0.31 0.35 0.54 —2bg 1.73 2 7.23×10 –5 — 25 — — — — — 23 4.71 0.01 0.01 0.03 0.04 0.075 —3 2.00 9.5 4.84×10 –5 — 29 — — 27.1 5.46 29 24 ML 12.00 0.00 0.00 0.02 0.02 0.06 —3ag 2.15 7 3.03×10 –3 14.73 54.8 1.097 0.590 0.819 6.1 — 33.2 24 3.64 0.06 0.08 0.19 0.20 0.30 0.953b 2.70 12 3.60×10 –5 — 54.1 — — — — — 32 CL 8.50 0.01 0.01 0.04 0.05 0.12 —4 3.00 20 7.23×10 –3 — 76.5 — — — — — 34 S 2.59 0.09 0.10 0.20 0.22 0.32 —4g 3.30 11 1.00×10 –2 14.69 49.1 1.002 0.595 0.802 5.5 — 34.8 32 3.00 0.10 0.14 0.27 0.30 0.430 0.944b 4.00 15 8.10×10 –3 — 75.1 1.166 0.742 — — — — 35 SP 2.33 0.09 0.10 0.17 0.21 0.55 —5g 6.30 26 4.00×10 –2 13.95 39 1.085 0.656 0.918 6.0 — 34.8 31 1.95 0.20 0.22 0.34 0.39 0.55 0.905 7.00 31 9.98×10 –5 — 70 — — 42.0 4.5 32–33 31 ML 6.57 0.00 0.00 0.02 0.02 0.05 —5b 7.00 14 3.24×10 –6 — 45.6 — — — — — 31 CL 5.56 0.00 0.00 0.01 0.01 0.05 —7g 7.10 24 4.00×10 –6 — 77.5 — — 36.9 — — 34 9.00 0.00 0.00 0.01 0.02 0.03 —6g 8.60 16 3.24×10 –2 14.71 63 1.114 0.633 0.811 5.8 — — 34 1.78 0.18 0.20 0.30 0.32 0.46 0.956 10.00 17 1.96×10 –2 13.78 52 — — — — — 32 S 1.43 0.14 0.09 0.14 0.20 0.30 —6 12.0– 15.0 23 3.23×10 –5 — 52 — — — — — 32 — — — — — —6 15.0–20.0 — — — 52 — — — — — 33 — — — — — —8g Channel — 3.60×10 –3 14.67 25.8 0.927 0.511 0.819 7.5 — 34 — 4.50 0.06 0.08 0.20 0.27 0.40 0.958ag Deposition — 1.60×10 –3 13.75 — — 0.941 2.8 — — — 7.00 0.04 0.07 0.21 0.28 0.49 0.887area8bg Depositionarea— 9.03×10 –5 13.95 — — 0.913 4.1 — — — 28.42 0.01 0.02 0.21 0.27 0.5 0.9SairanoSairano l — — 8.14×10 –3 13.83 0.927 0.511 0.89 — — 35 — SP 2.86 0.11 0.13 0.27 0.30 0.47 1.08Sairano 2 — — 3.79×10 –5 16.90 — — 0.54 — — — — SP 3.75 0.08 0.105 0.27 0.3 0.49 —*Number of blows in the Meardi DPSH test.† Computed using the formula of Hazen (1911), except Lefranc in situ tests for samples 3, 5, and 6 (12.0–15.0 m) from Groppello and laboratory permeameter tests for the Sairano samples.‡ Unified Soil Classification System.§ Critical hydraulic gradient. Undisturbed sample.1064 Can. J. Geotech. Vol. 36, 1999
Crosta and di Prisco 1065Fig. 9. (a) Grain-size analyses for a series of samples from the Groppello and Sairano sites. Samples correspond to those located alongthe stratigraphic profile in Fig. 8 and listed in Table 1. (b) Microscope images of the sand involved in the 1993 Groppello event(sample 6, as in Table 1 and Fig. 8).Investigating the mechanismof soils and the dislodgement of fine particles (Terzaghi andPeck 1967; Skempton and Brogan 1994).To understand this <strong>slope</strong> <strong>instability</strong> the following observationsmust be introduced:(1) A concentrated discharge of muddy water was observedat the toe of the <strong>slope</strong> in the late evening on June 27,© 1999 NRC Canada
1066 Can. J. Geotech. Vol. 36, 1999Fig. 10. Curves that define the dependency of (a) constantpermeability k and (b) volumetric water content on suction forthe different materials in the <strong>slope</strong>.a few hours before the <strong>slope</strong> failure. This clearly points to an<strong>erosion</strong> process at the toe of the <strong>slope</strong> which caused the removalof a specific size range of particles or all the availablesizes, increasing the pore size in the <strong>slope</strong> and resulting inturbulent water flow.(2) The limit of the failed area corresponds to the boundarybetween the rice and corn fields (Figs. 3, 4).(3) The upper sealing layer of organic topsoil was cut <strong>by</strong>20–30 cm deep incisions (Fig. 3). These incisions were created<strong>by</strong> tractor edged-blade wheels (or disk-shaped wheels)which are commonly employed for rice cropping in Italy.(4) Sub-horizontal cylindrical cavities (35–40 cm diameter)(Fig. 3d) located in the lower half (between 0.7–1.4 m)of the upper fine sand layer were preserved (Figs. 3c, 3d).The axial distance between each pair of pipes was about 2 m(Fig. 4), which is the distance between tractor wheels. Thetractor wheels cut the impermeable superficial layer causinginfiltration. Three pairs of pipes were found (Fig. 4), one coaxialwith respect to the channel and two lateral. This followsthe competitiveness principle mentioned in theliterature (Baker et al. 1990).(5) Partially preserved subcylindrical cavities (30–40 cmof diameter) with vertical axes were observed starting justbelow the bottom of the upper silt layer (Figs. 3c, 3d) andaligned with the overlying sub-horizontal pipes. The ensembleof sub-horizontal and vertical pipes suggests the occurrenceof a well-developed piping phenomenon. These verticalpipes suggest the presence of vertical cracks within the stiffsilt layer which allowed for the migration of <strong>seepage</strong> in theunderlying sand layer. These vertical cracks were likely theresult of both previous wetting–drying cycles and stress releasesubsequent to the river valley <strong>erosion</strong>.(6) Continuity of recharge was guaranteed <strong>by</strong> the shallowinterconnected ponds. The continuous recharge, hydraulicconductivity properties of the materials, number of infiltrationpoints, and duration of the event controlled the quantityof water flowing through the alluvial terrace.(7) The finer material forming the more external <strong>slope</strong>sector retarded water exfiltration, allowing for the increaseof water content in the coarser sand and the increase in waterpressure.(8) Two sectors with different <strong>slope</strong> gradients were recognizedin the deposition area. The steeper sector was locatedclose to the channel outlet, as described <strong>by</strong> Hagerty (1991a).The other sector, with a lower <strong>slope</strong> gradient, developed upto 100 m from the outlet (Fig. 4). This geometry is connectedto flow which spreads at the pipe outlet, with a consequentdrop in velocity and particle deposition close to theoutflow zone. The larger cone could be referable to rapidmass wasting or to the continuous reworking <strong>by</strong> the shallowrunoff fed <strong>by</strong> the floodwaters.(9) No vegetation survived within the area 30–40 m fromthe outlet, whereas beyond this area long reed stems wereonly partially submerged. This suggests violent depositionclose to the outlet and more fluid deposition farther from theoutlet.As mentioned in the Introduction and suggested <strong>by</strong> theabove observations, four distinct but strictly linked phenomenamay be assumed to have taken place: <strong>seepage</strong> <strong>erosion</strong>and tunnel scouring in the superficial layers, saturation ofdeeper soil layers, <strong>seepage</strong> <strong>erosion</strong> at the <strong>slope</strong> toe, and liquefactionof large soil masses. For the sake of simplicity,these phenomena will be discussed separately.Shallow <strong>seepage</strong> <strong>erosion</strong> and tunnel scouringHydraulic concentration may take the shape of pipes,which are tubular structures (Fig. 1), often ephemeral, frequentlysubject to collapse of their roofs with consequentformation of gullies with steep, amphitheatre-shaped heads.In the example presented here, the formation of multiplepipes was observed (Figs. 3, 4). The most important or leadingpipe, in the simpler case, <strong>induced</strong> the development ofsecondary pipes <strong>by</strong> increasing convergence and consequentlythe contributing area and the local hydraulic gradient. Competitionamong adjacent pipes (observation 5) was likely sostrong as to allow for the development of some of them.Before a detailed analysis of the observed uphill tunnelscouring phenomenon, it is important to observe the following:(1) The presence of superficial incisions and tensioncracks within the unsaturated soil layers <strong>induced</strong> localized© 1999 NRC Canada
Crosta and di Prisco 1067Fig. 11. Numerical 2D <strong>seepage</strong> analysis performed to interpret superficial soil piping: (a) sketch of boundary conditions (h, hydraulichead); (b) evolution of the saturation boundary at successive time steps; and (c) water-content contours at steady condition.water <strong>seepage</strong>. In this case they favoured <strong>seepage</strong> withindeeper, unsaturated, and relatively more permeable layers.(2) The spatial variation of hydrogeologic properties affectedthe flow field and, in particular, the presence of a underlyingwater flow contrast allowed for an increase in thehorizontal component of flow (Fig. 1).(3) The flow convergence at the toe of the <strong>slope</strong> whichwas likely due to a rise in the local water table (Fig. 1) increasedthe hydraulic gradient within the domain and, as aconsequence, influenced the evolution of superficial <strong>seepage</strong><strong>erosion</strong> and tunnel scouring. Flow convergence became progressivelymore important with the uphill spring head retreat,intensifying downhill the rate of headward <strong>erosion</strong> anduphill the <strong>seepage</strong> <strong>erosion</strong> and tunnel scouring.(4) No direct observations regarding the evolution of <strong>seepage</strong><strong>erosion</strong> and tunnel scouring exist, except for somesmall-scale physical models (Higgins et al. 1990), and geomorphicevidence is rarely discernible.Numerical modellingNumerical results of a two-dimensional (2D) analysis ofthe flow concentration phenomenon within a homogeneoussand layer will clarify the subvertical and sub-horizontal <strong>seepage</strong><strong>erosion</strong> and tunnel scouring within the upper sandy layer.<strong>On</strong>ly the hydraulic aspect was considered. The commercial finiteelement numerical code SEEP/W (Geo-Slope InternationalLtd. 1996a; Fredlund and Rahardjo 1993) was used.The 2D <strong>seepage</strong> within partially saturated soils was reproduced<strong>by</strong> assuming the sand within the layer to be uniformand hydraulically isotropic and homogeneous. The hydraulicproperties of the sand are summarized in Figs. 10a and 10b(uniform sand curves). The following assumptions were made© 1999 NRC Canada
1068 Can. J. Geotech. Vol. 36, 1999Fig. 12. Evolution of the saturated domain with time within the <strong>slope</strong> (see Fig. 7 for soil stratigraphy) as obtained <strong>by</strong> numericalmodelling (a) 1 month and (b) 5 months after deep incisions were made.concerning the initial boundary conditions (Fig. 11a): (i) thehydraulic head within the soil domain is initially constantwith the water table coincident with the lower boundary; (ii) ahydraulic head is applied at the upper right-hand corner(source); this hydraulically describes a single superficial incisioncutting through the flooded rice field (see observation 3in the previous section); (iii) a hydraulic head, constant withtime, is imposed on the lower left-hand corner (sink); this describesthe presence of a lower tension crack cutting throughthe low-permeability layer; and (iv) the remaining boundariesare assumed to be no-flow boundaries.In Fig. 11b, a schematic view of the evolution of the saturateddomain with time is represented. The presence of thelow-permeability layer (i.e., the grey silty layer) on the bottomand the tension crack causes saturation of a limitedzone. Moreover, the water flow becomes more localized withtime and the saturation bulb in the upper zone becomes moreand more narrow. This happens when the wetting frontreaches the sink (constant-head point at the lower left-handcorner, i.e., the tension cracks, Fig. 11a). From Fig. 11c, itisevident that the band within which the water contentchanges is very narrow. <strong>On</strong>ly within this narrow domain isthe material saturated (degree of saturation S r = 100%).These numerical results seem to justify, from a hydraulicpoint of view, the onset of <strong>seepage</strong> <strong>erosion</strong> and tunnel scouringwithin a superficial permeable layer above a relativelyimpermeable layer. Naturally, in three dimensions, it is possibleto imagine <strong>seepage</strong> localization within a tunnel of saturatedsoil. More simulations (not reported here for the sakeof brevity) were performed <strong>by</strong> increasing the distance betweenthe water source and the lower drainage point. Theseshowed that the saturated domain becomes more elongated.Seepage <strong>erosion</strong> and the propagation of tunnel scouringbecome possible if (i) the capillary stresses, which are <strong>induced</strong><strong>by</strong> partial saturation, are sufficient to ensure (at leasttemporary) stability of the tunnel opening; and (ii) there issufficient transport capacity (i.e., sufficient flow and minimumhydraulic gradient), which will erode sediments fromthe passage. The first condition may be satisfied if partialsaturation and the arching effect are taken into account. Withrespect to the second condition, an analysis of the problem ismore difficult.Seepage within the <strong>slope</strong>To interpret the onset of this kind of <strong>slope</strong> <strong>instability</strong>, it isimportant to point out that the collapse is the final result of acomplex chain of events taking place during a certain timeperiod. An important role is played <strong>by</strong> the <strong>seepage</strong> evolutionwith time within the entire <strong>slope</strong> domain. The analysis iscomplex because of the partial saturation of materials, the3D geometry of the problem, the heterogeneity of materials,and the presence of tension cracks and localized water flows.The hydraulic conductivity was about 2×10 –3 to3×10 –2 cm/s for the sands versus 3×10 –5 tol×10 –4 cm/sfor the silts (see Fig. 8 and Table 1). As the flow direction isinfluenced <strong>by</strong> the differences in hydraulic conductivitywithin the soil stratigraphy, it can be assumed that the flowcould be horizontally deviated.© 1999 NRC Canada
Crosta and di Prisco 1069Fig. 13. Sand box model of the <strong>slope</strong> simulating the 3D <strong>seepage</strong> within a homogeneous, initially dry, dense sand stratum: (a) lateralview; (b) section showing the saturated and partially saturated domains.Numerical modellingTo qualitatively reproduce and interpret the evolution ofthe hydraulic system of the entire <strong>slope</strong>, more numericalanalyses were performed using the SEEP/W computer program(see Fig. 12). The characteristic suction – water contentcurves for the different materials, as well as thedependency of the hydraulic conductivity on the water content,were taken as shown in Fig. 10. We must observe thatthe characteristic curve, which links the saturation index andthe suction pressure, is assumed to be reversible. A parametricstudy was performed <strong>by</strong> changing the dimensions and positionof both superficial incisions and tension cracks and© 1999 NRC Canada
1070 Can. J. Geotech. Vol. 36, 1999Fig. 14. Sketch showing the shape of the saturation bulb under a point water source as observed during the sand box experiments. Thebroken lines show the limits of the <strong>seepage</strong> zone on the <strong>slope</strong>. gwt, groundwater table.the initial distribution of the piezometric head. The lowerboundary of the domain was assumed to coincide with thelower water table shown in Fig. 7. It can be concluded thatthe presence of the 20–30 cm deep incisions allow the waterto infiltrate into the lower soil layers (Fig. 12a). Withoutthese incisions the seasonal rice field flooding could not explainthe saturation conditions of the <strong>slope</strong>.Moreover, simulations show that if tension cracks withinthe consistent grey silt were absent, the water would flowonly within the upper more permeable layer and would notaffect the lower sandy layer. Then, only a superficial <strong>erosion</strong>would be possible and not the deep-seated failure mechanismas observed.In the following the <strong>seepage</strong> within the layered <strong>slope</strong> willbe discussed <strong>by</strong> taking into consideration both superficial incisionsand tension cracks as illustrated in Fig. 12. The infiltrationfront develops with time. Its shape, in particular withinthe upper part of the <strong>slope</strong>, is influenced <strong>by</strong> the sequence oflayers with different permeabilities, as was also reported <strong>by</strong>Rulon and Freeze (1985). The toe of the <strong>slope</strong> is reached <strong>by</strong>the saturation front almost simultaneously with the establishmentof steady flow conditions. A parametric study has beenperformed to quantitatively describe the influence of floodingof the rice field on the saturation of soil layers. The computedtime period necessary for saturation of the lower sandylayer was comparable to the annual flooding time (about4 months). Nevertheless, this time interval cannot be quantitativelyrevealing because of (i) the imposed 2D geometricalconditions, and (ii) the difficulty in defining the permeabilityversus saturation ratio curve and its hysteretic behaviour.When the water flow reached the base of the <strong>slope</strong>(Fig. 12b), <strong>erosion</strong> at the toe of the <strong>slope</strong> took place. Thewater flow within the <strong>slope</strong> was made more rapid and thetunnel scouring in the upper soil strata more catastrophic.Evidently, only if the <strong>seepage</strong> is sufficiently developedwithin the <strong>slope</strong> does the phenomenon becomes self-feedingand <strong>instability</strong> occurs.Physical modellingTo qualitatively describe the shape of the saturated domain,when the water source is restricted, some simple laboratory-scalemodel tests were performed. The model <strong>slope</strong>swere reproduced within a sand box measuring 80 × 30 ×45 cm and having two glass windows. The <strong>slope</strong> model wascreated <strong>by</strong> pluviating dry homogeneous Hostun RF sand toachieve a relative density Dr of 40%. The lower boundarywas kept saturated during the test, whereas the sand waskept dry initially. A perched water table was established onthe top <strong>by</strong> placing a small basin on the top of the model<strong>slope</strong> with a hole at its base to induce a localized <strong>seepage</strong>source.The shape of the saturated domain is evident in Fig. 13. Alateral view of the <strong>slope</strong> is illustrated in Fig. 13a, and the finalsection of the partially saturated bulb is shown inFig. 13b. This was obtained <strong>by</strong> brushing away the dry sandat the end of the test. Even though the deposit was homogeneous,the material was initially not partially saturated, andno tension cracks or tunnel scouring were observed, the experimentalobservations were useful in describing the 3Dshape of the <strong>seepage</strong> domain. The initial and final positions© 1999 NRC Canada
Crosta and di Prisco 1071Fig. 15. Plan sketch of the intersection of saturated zonesunderneath three sets of superficial incisions. Flow localization isshown at three successive time steps t 1 , t 2 , and t 3 .of the groundwater table are shown together with the initialand final bulb profiles in Fig. 14.If we now reinterpret the actual <strong>seepage</strong> within theGroppello <strong>slope</strong> <strong>by</strong> taking into consideration the experimentalobservations, we may describe the final geometry of thesaturated domain within the <strong>slope</strong> caused <strong>by</strong> multiple watersources (three pairs of superficial incisions) as shown schematicallyin Fig. 14. As previously observed, toe <strong>erosion</strong>took place only in a narrow zone above the exit point A. The3D evolution of the saturated domain (ellipses at times t 1 –t 3in Fig. 15) was likely to be influenced <strong>by</strong> the localized flowat point A, which could explain the elongated shape of thefinal failure mechanism (ellipse at t 3 in Fig. 15). As observedin the 2D model (Fig. 12a), the shape of the saturateddomain changes when <strong>slope</strong> boundaries are reached. Asshown in the 3D representation (Fig. 16) the saturated bulbbecomes more and more narrow and elongated with time towardthe drainage boundary when <strong>seepage</strong> reaches the toe ofthe <strong>slope</strong>.Soil liquefactionThe hydraulic aspects of the phenomenon were discussedin the previous sections. In this section some hypotheses willbe inferred about the <strong>slope</strong> failure. First, the <strong>slope</strong> is veryclose to limit equilibrium, because of its inclination of 30–32°. More critical conditions could have been reached becauseof the infiltration from the water ponding on top of theterrace and the consequent saturation of the <strong>slope</strong> material.<strong>On</strong>e or more successive shallow <strong>slope</strong> failures could have occurred,creating <strong>slope</strong> concavities (Fig. 16) and exposingzones of higher permeability, thus inducing a subsequentflow confluence. Several limit-equilibrium analyses wereperformed in two dimensions using the SLOPE/W software(Geo-Slope International Ltd. 1996b) and results of the flowFig. 16. Three-dimensional sketch of transient saturated fronts and sequential <strong>slope</strong> failures (see shaded volumes and failure surfacesnumbered 1–5), mainly limited to the highly saturated <strong>slope</strong> sector below the water point sources. wt, water table.© 1999 NRC Canada
1072 Can. J. Geotech. Vol. 36, 1999simulations. The general <strong>slope</strong> stability just before the eventwas assessed considering different water table conditionsand contemplating both general and local <strong>slope</strong> failures. Inthe presence of a perched water table, the factor of safetyvalue decreases, leading to shallow failures and the incipient<strong>instability</strong> conditions (see Fig. 16). A sudden local saturationcould have caused the abrupt loss of the temporary cohesivecomponent.It seems that the pipeline, cutting through or disturbingthe impermeable silty layer, did not play a major role in the<strong>instability</strong> at the Groppello site. In fact, no disturbance occurredto the pipeline (Fig. 4) contrary to what was observedat the Sairano site (Figs. 5, 6a).Finally, the morphology of the accumulation, the type oftransport, the exceptionally large distance of the materialspreading, and the low inclination of the final failure surfacesupport the hypothesis that soil liquefaction occurred. Thegeneral bottleneck shape of the failure suggests a powerfuland sudden mass failure (Torrey and Weaver 1984) insteadof a slow progressive detachment of single blocks, successivelytransported or dismantled through the outlet channel.In fact, no stiff silty blocks were recognized within the depletionarea at the end of the event.As observed <strong>by</strong> Eckersley (1985), soil liquefaction is notnecessarily the initial triggering factor of the <strong>instability</strong>, butonly an associated phenomenon, which makes the <strong>instability</strong>more dangerous and catastrophic. When pore pressure suddenlyincreases, liquefaction takes place and the soil flowslike a fluid. As observed <strong>by</strong> many authors (Lindenberg andKoning 1981; Skopek et al. 1994; di Prisco and Imposimato1997), soil saturation is not necessary for liquefaction tooccur, but the presence of water and an increase in porepressure, which follows the collapse of the granular microstructure,may become important in propagating the <strong>instability</strong>.The liquefaction of part of the soil mass may explain thesecond phase which is characterized <strong>by</strong> a rapid flow slidealong a gently inclined gully with very steep banks, eventhough the shape of the saturated domain at the instant offailure can explain the elongated shape of the gully.Concluding remarksThe case history presented in this paper shows the difficultyin differentiating the sequence of the various factorsand attributing their role and importance for the initiation of<strong>seepage</strong> <strong>erosion</strong> and triggering of <strong>slope</strong> failure.The case investigated is likely the result of a relativelyrapid <strong>seepage</strong> <strong>erosion</strong> process started during the crop seasonbecause of agricultural techniques characterized <strong>by</strong> 3–4 months of flooding.The point water sources along the superficial incisions,the condition of prolonged water feeding imposed <strong>by</strong> the tillagesystem, the presence of tension cracks within the soillayers, and the condition of partial saturation of granularsoils caused the development of tunnel scouring in the upperportions and shallow toe <strong>erosion</strong>.The localized water sources close to the terrace <strong>slope</strong>, thecondition of partial saturation, and the depth of the water table,coincident with the elevation of the toe of the <strong>slope</strong>,controlled the evolution of the wetting front and the saturatedsubcylindrical bulb. A fundamental role was played <strong>by</strong>the 3D development of the saturated domain, <strong>induced</strong> <strong>by</strong> thelocalized sources. The 3D water front evolution was referredto the rise in the local water level. The local hydraulic gradientat the toe of the <strong>slope</strong> was increased <strong>by</strong> boundary conditionsand <strong>by</strong> the upper level piping process. As aconsequence, toe <strong>erosion</strong>, local <strong>slope</strong> <strong>instability</strong>, and quicklypropagating sand liquefaction were the successive stepswhich characterized the overall <strong>slope</strong> failure.AcknowledgementsThe author is indebted to Paolo Broggi for help in performingpart of the modelling and to Prof. Andrea Cancellifor data from the 1980 event in Sairano. The research hasbeen funded <strong>by</strong> a MURST 40% grant.ReferencesBaker, V.R., Kochel, R.C., Laity, J.E., and Howard, A.D. 1990.Spring sapping and valley network development. In Groundwatergeomorphology. Edited <strong>by</strong> C.G. Higgins and D.R. Coates.Geological Society of America, Special Paper 252, pp. 235–265.Casagrande, A. 1936. Characteristics of cohesionless soils affectingthe stability of <strong>slope</strong>s and earth fills. Journal of the BostonSociety of Civil Engineers, 23: 13–32.CIRIA. 1986. Control of groundwater for temporary works. ConstructionIndustry Research and Information Association,CIRIA, Report 113, London.di Prisco, C., and Imposimato, S. 1997. Experimental analyses andtheoretical interpretation of triaxial load controlled loose sandspecimen collapses. In Mechanics of cohesive–frictional materials.Vol. 2, pp. 93–120. Edited <strong>by</strong> F. Darve and R. de Boerst,Elsevier, Amsterdam.Dunne, T. 1990. Hydrology, mechanics, and geomorphic implicationsof <strong>erosion</strong> <strong>by</strong> subsurface flow. In Groundwater geomorphology.Edited <strong>by</strong> C.G. Higgins and D.R. Coates. GeologicalSociety of America, Special Paper 252, pp. 1–28.Eckersley, J.D. 1985. Flowslides in stockpiled coal. EngineeringGeology, 22: 13–22.Fredlund, D.G., and Rahardjo, H. 1993. Soil mechanics for unsaturatedsoils. John Wiley, New York.Geo-Slope International Ltd. 1996a. SEEP/W user’s guide. Version4.02. Geo-Slope International Ltd., Calgary, Alta.Geo-Slope International Ltd. 1996b. SLOPE/W user’s guide. Version3. Geo-Slope International Ltd., Calgary, Alta.Hagerty, D.J. 1991a. Piping/sapping <strong>erosion</strong>. I: basic considerations.Journal of Hydraulic Engineering, 17: 991–1008.Hagerty, D.J. 1991b. Piping/sapping <strong>erosion</strong>. II: identification–diagnosis.Journal of Hydraulic Engineering, 17: 1009–1025.Hazen, A. 1911. Discussion of “Dams on sand foundation” <strong>by</strong>A.C. Koenig. Transactions of the American Society of Civil Engineers,73: 199.Higgins, C.G. 1984. Piping and sapping; development of landforms<strong>by</strong> groundwater outflow. In Groundwater as a geomorphic agent.Edited <strong>by</strong> R.G. LaFleur. Allen & Unwin, Boston, pp. 18–58.Higgins, C.G., Hill, B.R., and Lehre, A.K. 1990. Gully development.In Groundwater geomorphology. Edited <strong>by</strong> C.G. Higginsand D.R. Coates. Geological Society of America, Special Paper252, pp. 139–155.Hutchinson, J.N. 1968. Field meeting on the coastal landslides ofKent. In Proceedings of the Geologists’ Association ‘79, Part II,pp. 227–237.© 1999 NRC Canada
Crosta and di Prisco 1073Hutchinson, J.N. 1982. Damage to <strong>slope</strong>s produced <strong>by</strong> <strong>seepage</strong><strong>erosion</strong> in sands. In Landslides and mudflows. Edited <strong>by</strong> A.Sheko. Reports of Alma Ata International Seminar, October 1981,Centre of International Projects, GKNT, Moscow, pp. 250–265.Jones, J.A.A. 1990. Piping effects in humid lands. In Groundwatergeomorphology. Edited <strong>by</strong> C.G. Higgins and D.R. Coates. GeologicalSociety of America, Special Paper 252, pp. 111–138.Koenders, M.A., and Selimeyer, J.B. 1992. Mathematical modelfor piping. Journal of Geotechnical Engineering, 118: 943–946.Koppejan, A.W., van Wamelen, B.M., and Weinberg, L.J.H. 1948.Coastal flow slides in the Dutch province of Zeeland. In Proceedingsof the 1st International Conference of the InternationalSociety of Soil Mechanics and Foundation Engineers, Rotterdam,Vol. 4, c13, pp. 89–96.Lindenberg, J., and Koning, H.L. 1981. Critical density of sand.Géotechnique, 31: 231–245.Rulon, J.J., and Freeze, R.A. 1985. Multiple <strong>seepage</strong> faces on layered<strong>slope</strong>s and their implications for <strong>slope</strong> stability analysis.Canadian Geotechnical Journal, 22: 347–356.Skempton, A.W., and Brogan, J.M. 1994. Experiments on piping insandy gravels. Géotechnique, 44: 449–460.Skopek, O., Morgenstern, N.R., Robertson, P.K., and Sego, D.C.1994. Collapse of dry sand. Canadian Geotechnical Journal, 31:1008–1014.Terzaghi, K., and Peck, R.B. 1967. Soil mechanics in engineeringpractice. John Wiley & Sons, Inc., New York.Torrey, V.H., and Weaver, F.J. 1984. Flow failures in Mississippiriverbanks. In Proceedings of the 4th International Symposiumon Landslides. University of Toronto Press, Downsview, <strong>On</strong>t.,Vol. 2, pp. 355–360.Worman, A. 1993. Seepage-<strong>induced</strong> mass wasting in coarse soil<strong>slope</strong>s. Journal of Hydraulic Engineering, 119: 1155–1168.© 1999 NRC Canada