71 - OKI
71 - OKI
71 - OKI
- No tags were found...

Create successful ePaper yourself
Turn your PDF publications into a flip-book with our unique Google optimized e-Paper software.
Chapter 7Safety
CHAPTER 7SAFETYOne of the main goals of this Plan is to improve travel safety by reducing the riskof crashes that cause death or injuries and provide for the security oftransportation users. Traffic crashes are a serious problem across the nation andin our region. The United States Department of Transportation (USDOT)indicates that nationally:• Traffic deaths rose from 42,196 in 2001 to 42,815 in 2002. This is thehighest number of motor vehicle fatalities in over a decade.• Deaths of young drivers (ages 16-20) increased by more than 5% in 2002compared to 2001 – a total of 3,723 deaths.• Motor vehicle crashes remain the leading cause of death and disability forAmericans between the ages of two and 33.• Alcohol-related fatalities increased to a total of 17,419 deaths in 2002, upfrom 2001.• For the fifth consecutive year, motorcycle deaths climbed, totaling 3,244in 2002 – a 50% increase since 1997.• More than 50% of those people killed in motor vehicle crashes in 2002were not protected by a seat belt.The National Highway Traffic Safety Administration (NHTSA) estimates thatcrashes in the nation:• Cost each American an average of $820 annually• Drain a total of $81 billion annually in lost productivity• Create approximately $32.6 billion in medical expenses• Result in $52 billion in property damage• Incur on average approximately $1.1 million in crash-related costs for acritically injured survivor over his or her lifetimeIn the <strong>OKI</strong> region, between 2000 and 2002, there were 210 fatal crashes onstate and federal routes in Ohio and Kentucky. Every person in the <strong>OKI</strong> region isimpacted by the cost of traffic crashes. These costs are felt by an incrementalloss in productivity due to non-recurring congestion, actual property damagecosts and monetary costs associated with medical expenses, increased insurancepremiums and legal fees. Improving travel safety will have positive impacts forevery person in our region.<strong>OKI</strong> 2030 Regional Transportation Plan 2004 Update 7-1
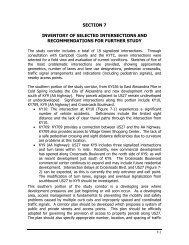
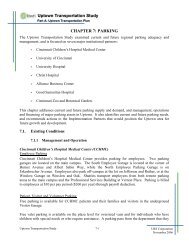
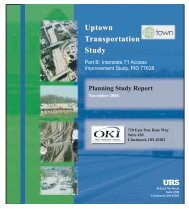
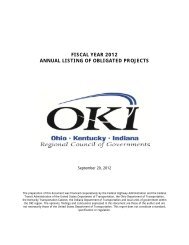
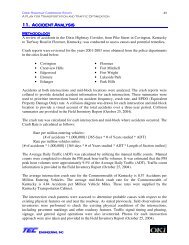
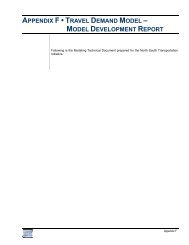
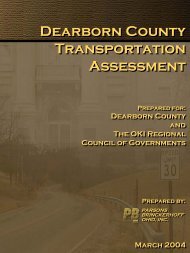
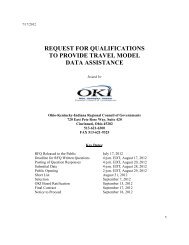
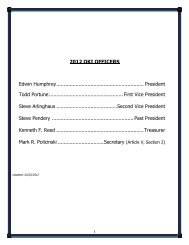
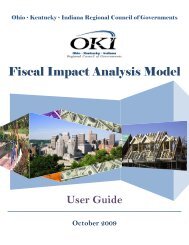
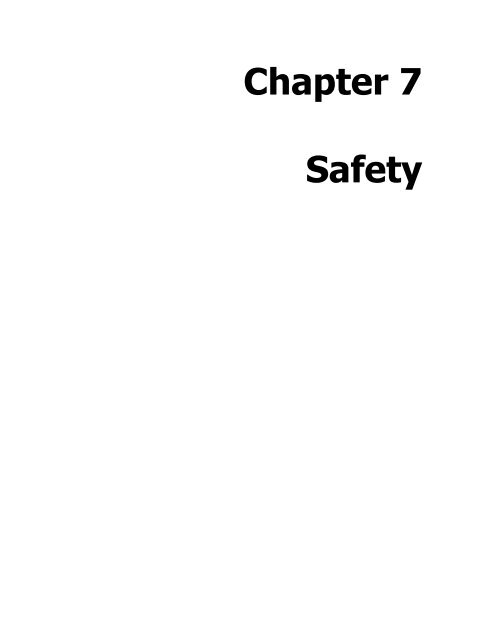
CRASH TRENDSThe first step in improving travel safety is determining where most crashes occurso that safety improvements for those areas can be explored. Since the lastpublication of this Plan, <strong>OKI</strong> has been able to acquire crash data from the OhioDepartment of Transportation (ODOT) and the Kentucky Transportation Cabinet(KYTC) for state and federal highways in the region. This data spans the threeyearperiod between 2000 and 2002.Crash trends are first revealed in Figure 7-1 for Ohio and Figure 7-2 forKentucky. Those areas in darkest red have the highest concentrations of crashes.Most of these high crash concentrations occur at the busiest intersections in theregion.Examining crash rates by roadway segment further reveals crash trends in ourregion as shown in Figure 7-3 for Ohio and Figure 7-4 for Kentucky. In mostcases, the use of crash rates (expressed as the number of crashes per millionvehicle miles) is a better measure of the safety condition of the roadway becauseit takes into account traffic volume. As shown in Figures 7-3 and 7-4, segmentsin more pronounced darker red have higher crash rates while those in yellowhave lower crash rates.CRASH REDUCTION<strong>OKI</strong>, in cooperation with its member agencies, plays a key role in reducing thenumber and severity of crashes. While implementing agencies (state and localgovernments) are responsible for determining engineering improvements to thehighway system, <strong>OKI</strong> assists in identifying high-risk locations. <strong>OKI</strong> has longincluded crash data as part of the Plan and Transportation ImprovementProgram (TIP) prioritization process, but was limited to the use of statewiderates for various facility types. Now, because of the route specific crash dataavailability, <strong>OKI</strong> has incorporated this route-specific data into its long-rangetransportation planning project prioritization process. <strong>OKI</strong> is also now preparedto respond to the increased emphasis on safety anticipated in upcoming federaltransportation planning guidelines.As a starting point, <strong>OKI</strong> has identified the 10 highest crash rate locationsexpressed in Million Vehicle Miles (MVM) along state and federal routes inKentucky and Ohio as listed in Table 7.1 on the following page. These locationsare candidates for safety improvements so that the safety goals of this Plan canbe realized.Integration of crash data and congestion management tools allow identificationof likely causes for crashes in certain locations. It is apparent that solving somecongestion problems will lead to the reduction of crashes. Other high crashlocations in non-congested areas indicate highway design problems, operational7-2 <strong>OKI</strong> 2030 Regional Transportation Plan 2004 Update
Figure 7-1ST 123 ST 132ST 744 ST 350ST 122¾¡ 27 ST 4 ¾¡ 42ST 747 ST 727¾¡ 50 ¾¡ 52 §¨¦4<strong>71</strong>ST 73¾¡ 127BUTLERST 741§¨¦74 HAMILTONST§¨¦275ST 28COUNTY ¾¡ 42§¨¦75ST 503¾¡ 42ST 73 ST 48COUNTYWARRENCOUNTY§¨¦<strong>71</strong>ST¾¡ 22ST 132§¨¦275ST 126 ST 48ST 264ST 131§¨¦<strong>71</strong>ST 561ST 222 ST 276CLERMONTCOUNTYST 749 ST 125ST 732 ST 177 ST 73ST 129 ST 123ST 126 ST 133ST 126 ST 32 ST 133¾¡ 52 ¾¡ 27 ¾¡ 50 ST 3ST 562 ST 286Crash ConcentrationsOhio, 2000-2002LegendLowMediumHighST 130 ST 774ST 63 ST 232 ST 743ST 128 ST 222Data Source: Ohio Department of Transportation0 2 4 8 12 16¾¡ 52ST 756Miles¬
Figure 7-2Crash ConcentrationsKentucky, 2000 -2002ST ST 1120ST 237 ST 1892ST STST 1017 ST 2925ST 1303 ST 709 ST 735ST 2951 ST 824ST 1292ST 8§¨¦275ST 445ST 3070ST 3035 STST 2924ST 1997ST ST 15661486ST 915STST CAMPBELL2921ST 536 ST KENTONCOUNTY3060§¨¦75STCOUNTY2044¾¡¾¡ STST 127ST 1996 1925 ST 1121STST 10¾¡ 42 ST ST ST 20421936ST ST 28282043 §¨¦<strong>71</strong> ST 16 ST 3072ST ST 17ST 154ST 2954ST 14 ST 1548ST 491 ST 2363 ST 2046ST 842 ST 1829 ST 1829 ST 2376ST 18 ST 3168 ST 236ST 20 ST 1072§¨¦<strong>71</strong>STST 23723<strong>71</strong>ST 1632ST STST 4453076 2967ST ST 23733187ST 2238STST 19983147 §¨¦4<strong>71</strong>ST 2978ST 1732ST 3235 6168 ST3490STSTST 8<strong>71</strong>7ST 3148ST 3151 ST 547STBOONE1501 ST 1930STSTCOUNTY3503 ¾¡ 338 27ST 9ST 177ST 3083ST 2374LegendLowMediumHighData Source: Kentucky Transportation Cabinet0 1 2 4 6 8Miles¬
Figure 7-3ST 123 ST 132ST 744 ST 350ST 73ST 503ST 732 ST 177¾¡ 42ST 122 STST 4873ST 4 WARRENCOUNTYST 132¾¡¾¡ 50 52¾¡ 27 ST 741BUTLERCOUNTY§¨¦<strong>71</strong>¾¡ 22ST 73¾¡ 127ST 748 ST 126 ST 126 ¾¡ 42ST 562 ST ST 32§¨¦275 §¨¦74¾¡ 27HAMILTONCOUNTY¾¡ 52 ST 3ST 129 ST 123ST 126ST 133¾¡ 50 §¨¦4<strong>71</strong>ST 264ST 131ST 286ST 747 ST 276CLERMONTCOUNTYST 133¾¡ 42§¨¦275ST 48STST 28126§¨¦75§¨¦<strong>71</strong>ST 561¾¡ 27ST 727ST ST 749 125Crash Rates byRoadway SegmentsOhioLegendLess Than 1 Accident per MVM*More Than 1 Accident per MVM*More Than 3 Accidents per MVM*More Than 5 Accidents per MVM*More Than 7 Accidents per MVM*No DataST 130 ST 774ST 63 ST 232 ST 743ST 128 ST 222* Million Vehicle MilesData Source: Ohio Department of Transportation0 2 4 8 12 16¬¾¡ 52ST 756Miles
Figure 7-4ST ST 1120ST 445ST 2345ST 842 ST 2951 ST 824ST 154§¨¦275ST 2374 ST 8ST 2967 ST 3070 STST 2924ST 1486ST 915ST 2045ST 16 ST 1121STST 2376ST 1829ST 2043 §¨¦<strong>71</strong>ST 3072 ST 14ST 2046 ST 2042ST 1280ST 3168 ST 236ST 20 ST 1072§¨¦<strong>71</strong>STST 23723<strong>71</strong>ST 1632STST 4453076 ST ST 23733187ST 2238STST 19983147 §¨¦4<strong>71</strong>ST 2978ST 1732ST 3235 6168 ST3490STSTST 8<strong>71</strong>7ST 3148ST 3151 ST 547STBOONEST 18291501 ST 1930STSTCOUNTY3503 ¾¡ 338 27ST 9ST 177ST 3083ST 237 ST 1892ST 2926ST 1017ST 18 ST 2925ST 1303 ST 709ST 3035 ST 1997ST 1566STCAMPBELL2921ST 536 ST KENTONCOUNTY3060§¨¦75STCOUNTY2044¾¡¾¡ 25ST 1996 ST 127735ST 1925 ST 10ST 1292 ST 1936ST 2828ST 16 ST¾¡ 1742 ST 2954ST 14 ST 1548ST 491 ST 2363Crash Rates byRoadway SegmentsKentuckyLegendLess Than 1 Accident per MVM*More Than 1 Accident per MVM*More Than 3 Accidents per MVM*More Than 5 Accidents per MVM*More Than 7 Accidents per MVM*NO DATA* Million Vehicle MilesData Source: Kentucky Transportation Cabinet0 1 2 4 6 8Miles¬
issues or driver error. Bold entries in Table 7-1 indicate high crash locationswhere congestion does not appear to be the primary contributor to crashes andwhich require further engineering study.Table 7-1Ten Highest Crash Rate Locations in <strong>OKI</strong> Region (By State)KentuckyCounty Route From To Crash Rate (MVM)Campbell US 27 E. 5th St. 19th St. 28.61Kenton KY 17 Ohio River Pleasant St. 27.60Kenton KY 17 Byrd St. E 24th St. 17.72Campbell US 27 Ohio River 5th St. 15.<strong>71</strong>Campbell KY 8 Licking River I-4<strong>71</strong> 14.02Kenton KY 8 Parkway Ave. Russell St. 13.20Kenton KY 8 Russell St. Licking River 12.69Campbell KY 1120 Licking River Washington Ave. 12.68Boone KY 18 SR 842 I-75 11.55Boone US 25 SR 1017 US 42 11.39OhioCounty Route From To Crash Rate (MVM)Hamilton SR 264 South Rd. Race Rd. 7.97Clermont SR 125 Hopper Hill Glen Este-Withamsville 6.43Hamilton US 22 US 52 Eggleston 5.70Hamilton US 27 I-74 Western Hills Viaduct 5.59Hamilton US 127 Western Hills Viaduct 9th St. 5.46Hamilton SR 747 Sharon Rd. SR 4 5.38Clermont SR 131 Wolfpen Pleasant Hill Buckwheat 4.85Clermont SR 32 I-275 Old SR 74 4.84Hamilton US 22 E. Court St. Martin Luther King 4.79Clermont SR 28 SR 28 Bypass Woodville Pike 4.72It is recommended that further engineering studies be conducted on crashlocations where congestion does not appear to be the primary contributor.<strong>OKI</strong> 2030 Regional Transportation Plan 2004 Update 7-3